ArcGis storymap is a web-based application that allows the user to create a narrative with the use of a map. Using this application can help to visualize information and tell a story in an engaging and interactive way. With the option of including videos and images, ArcGis storymap is the perfect place to engage an audience in a visually pleasing Digital Humanities project.
For my tutorial, I will be using major dates from my life and the different places I have been moving around to as an example. Enjoy!
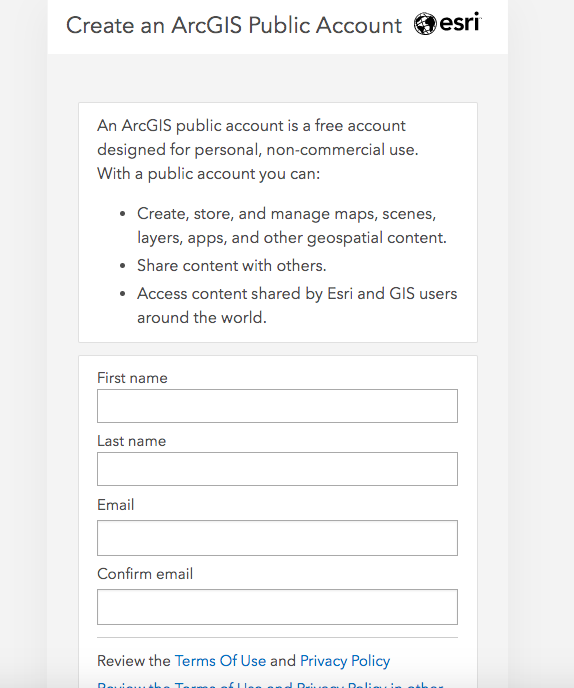
Step 1. Sign up or sign in to an ArcGis account. You can make a public account that does not offer as many details, but will still let you create and save a basic story.
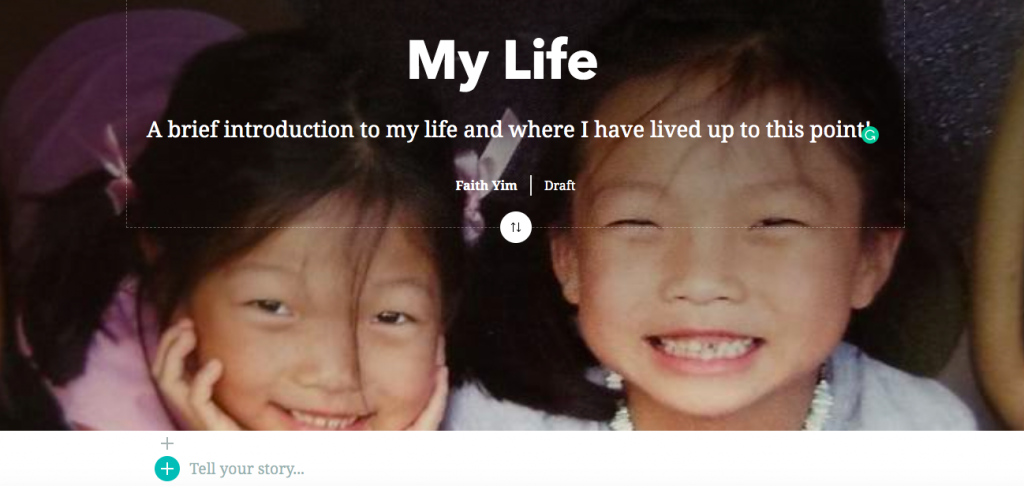
Step 2. Create a narrative. Get started by creating a new story. Add the title and a picture. Here’s my twin sister and me!
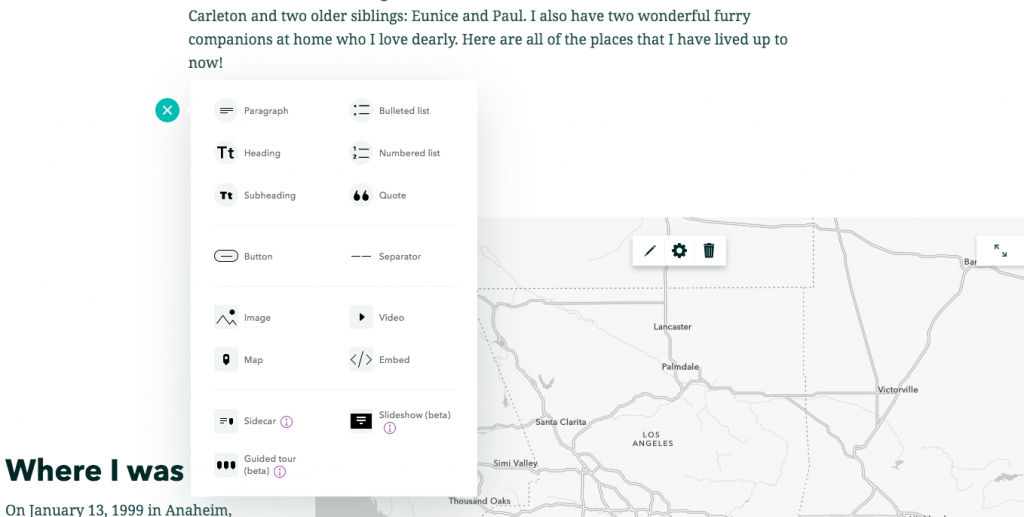
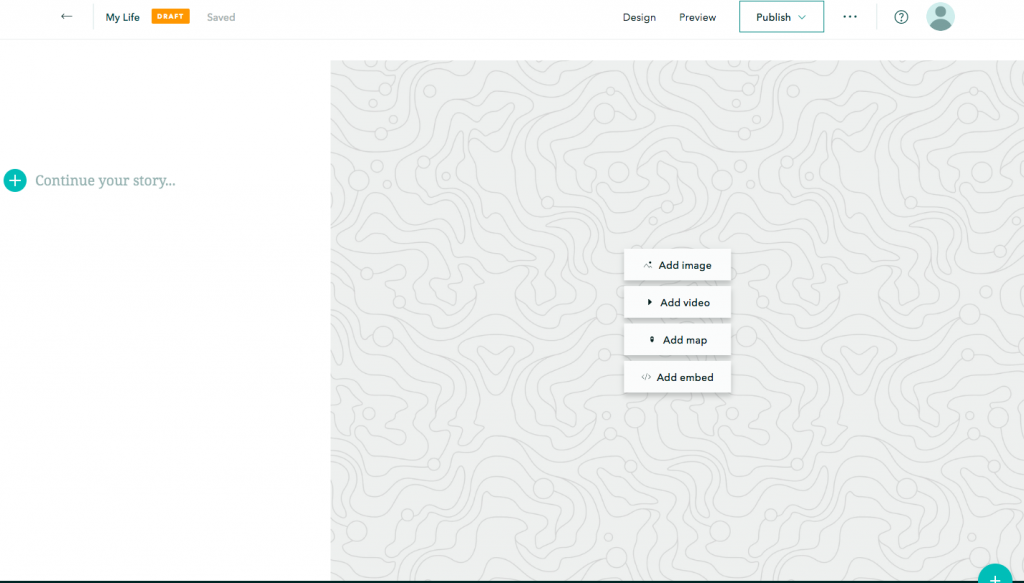
Step 3. Moving around. Below the first title page is a green plus sign. If you click that, it’ll open up a large box of different tools you can play with. To begin, we will start by opening up a paragraph.
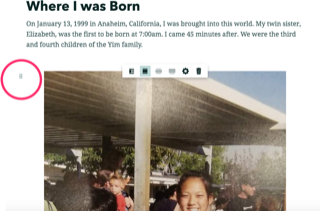
You can add all different kinds of elements to your document, but I stuck with a simple text and photo combination. The six little dots symbol allows you to also drag and drop the piece around to make your page exactly how you want it.
I am going to continue adding the main events in my life and all of the places I have lived.
Step 4. Add a slideshow. Go to the “slideshow” option at the bottom of the green plus sign menu. Click on it.
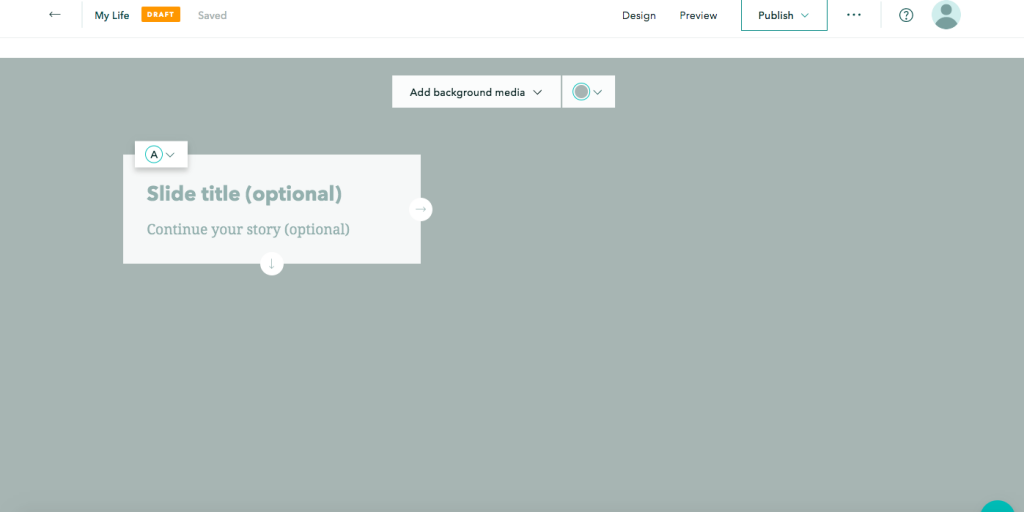
It should open up like this. Click on the top “Add background media” and “Add image.” You can include however many photos you want by clicking the plus sign at the bottom right corner. I put in some pictures from my childhood.
Step 5. Making a map with sidecar. Go to the “sidecar” option in the green plus sign menu at the bottom, next to the slideshow option. Click it and choose “add map,” then choose “create an express map” to begin plotting some points. You can have each slide correspond with a different text so that it scrolls through like a slideshow. Once you are finished, click “place map.” You can also always add slides like how you do with the slideshow option.
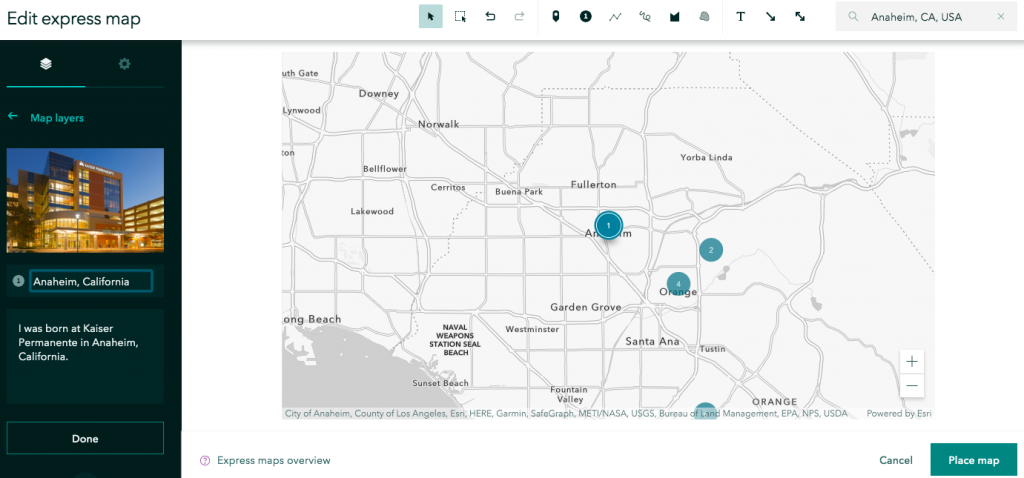
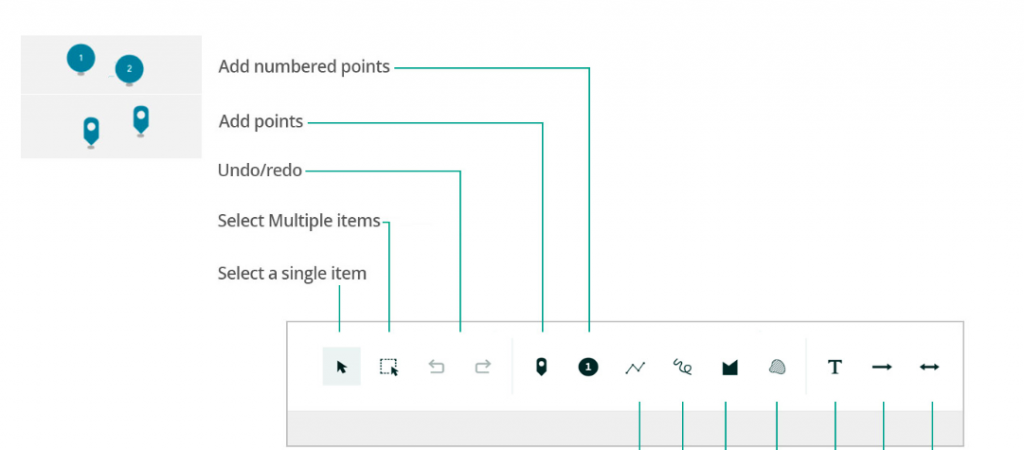
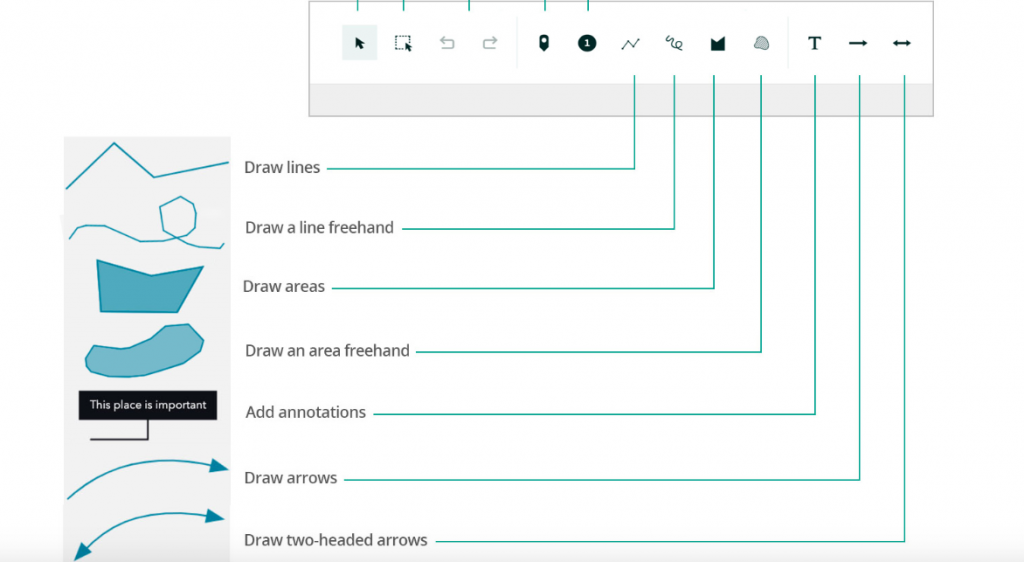
There is a toolbar at the upper right-hand corner that allows you to do different things with the map. You can add arrows, number the locations, etc. I plotted some points using the numbered points and the search bar at the top right. I also included some pictures and a small description in the left bar for each point.
You can either make a sidecar, dynamic map like this or choose to make one, static map that can plot all the points. To do that, you simply choose “add map” in the plus sign menu, rather than the sidecar option.
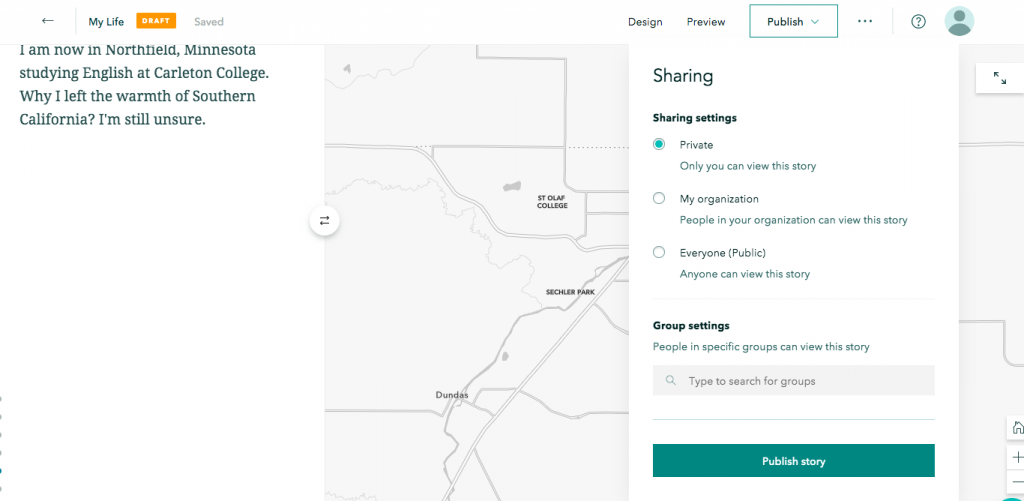
Step 6. Publish. Once you are satisfied with what you have (and in this case, a pretty basic model), click publish and choose the privacy settings you want. You’re done!
Here is a link to my project if you need!
https://storymaps.arcgis.com/stories/60c0850ff3f14ef9b732b55cf2c1875e
Here is a link to the ArcGis Storymap website’s tutorial if you need extra help: https://storymaps.arcgis.com/stories/cea22a609a1d4cccb8d54c650b595bc4
Here is a link to their FAQs page in case you have some unanswered thoughts:
https://doc.arcgis.com/en/arcgis-storymaps/get-started/faq.htm
3 replies on “ArcGis Storymap Tutorial”
This looks like a really useful tool for people who like to travel and record their experiences with photos. I hope to make my own travel map in lots of detail when I am able to get some free time. Your steps provide useful information on how to use the tools, and the story map site itself is also quite user friendly (especially compared to regular ArcGIS).
This is a really great tutorial! We are using this tool in our final project, but one of my partners has been more in charge of most of the mapping, so it’s nice to be able to learn what she’s had to learn on the job! The tool is incredibly useful and accessible, and I could see myself using it even on non-academic projects. I love that you used data from your own life — it made the tutorial feel much more personal and already inspired me with ways I could use the tool. Good post!
This tutorial was really helpful! It was vey easy to follow and the final product was esthetically pleasing!