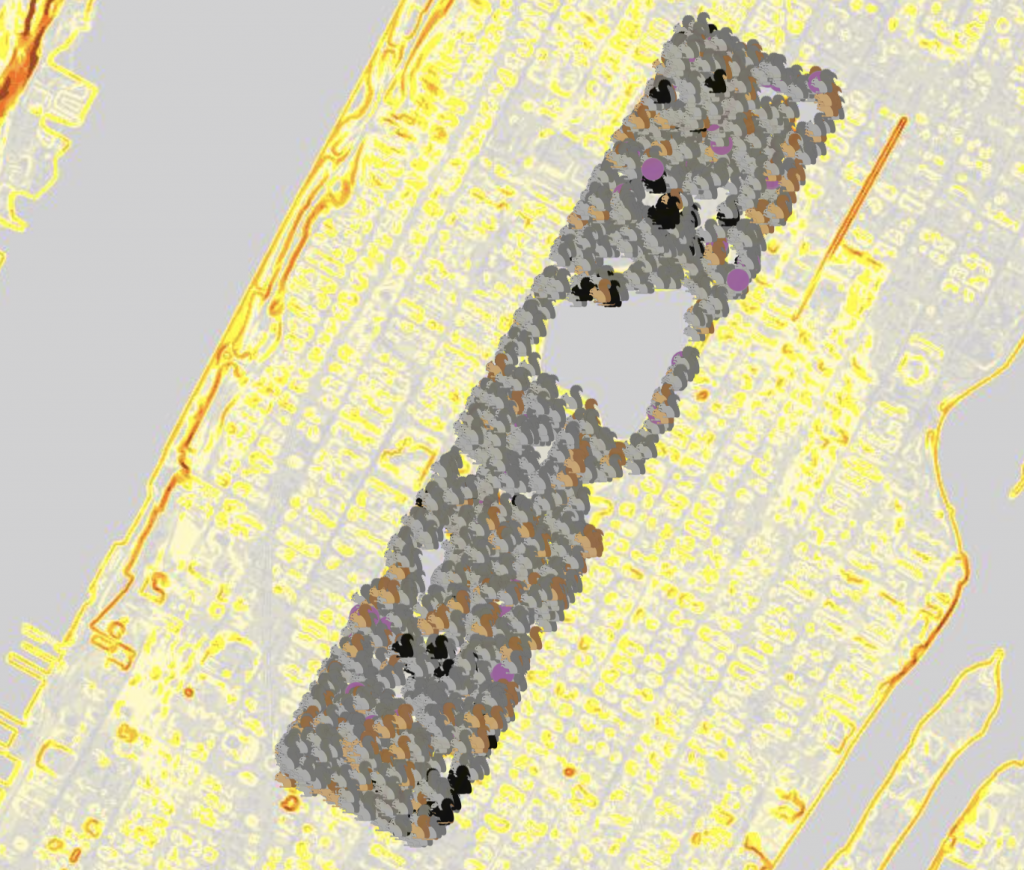
This map shows the relationship between elevation and squirrel sightings in Central Park. The base layer is a map of New York City, followed by a layer of the squirrel census data. The last layer is the elevation of New York City.
Each type of squirrel (grey, brown, and black) is depicted by a picture of a grey, black, or brown squirrel. Land elevation is depicted by shades of yellow: darker shades are higher above sea level and lighter shades are closer to sea level.
I’m impressed with how easy it was to create this map. Overall, it was a good experience. Here is the link to the map: https://arcg.is/S8KO5
https://arcg.is/S8KO5
One reply on “Elevation vs. Squirrel Sightings”
Great map! I thoroughly enjoyed my experience making the map as well!