What is it?
jsFiddle is an online web development environment that is perfect for testing and sharing code with others. I would describe jsFiddle as a web developers best friend. jsFiddle gives users and simple, intuitive way to write HTML, CSS, and Javascript by provided each of these core web technologies with its own panel.
Why should you use it?
As someone who has used jsFiddle countless times, I firmly believe it is a tool that every web developer and digital humanist should know about and use. jsFiddle provides and intuitive layout that simplifies code testing. Web development testing can be a hassle, you’re constantly trying to manage 3 separate files for your HTML, CSS, and Javascript and have to open up a browser window when you want to test some code. jsFiddle simplifies this process by putting this all into one window, making it a great tool to learn web development.
Another benefit to jsFiddle is the javascript library support is provides. A library is a collection of functions that a program can use. They are useful for code than needs to be run repeatedly and often provide powerful functions that vanilla javascript cannot provide. By providing an extensive array of libraries to choose from, the user does not need to worry about downloading or linking to these libraries.
One of the biggest reasons to use jsFiddle is its emphasis on community. jsFiddle makes it very easy to share your workspace with others, making it a great tool to help others and ask help from others. If you have used stackoverflow before (an online community for asking and solving programming questions) then who would have noticed that many of the questions and solutions for web development problems are shared via jsFiddle. There is also “collaborate” feature that is great when you are working with a team and would like multiple people to be able to change your code at once. (Think google docs for programming).
As a quick introduction to jsFiddle and some of the things you can do with it, I am going to be providing a tutorial on how to create a simple line chart using CanvasJS (a library that can be selected within jsFiddle)
Tutorial 1 : Hello World
Step 1: Open up jsFiddle by going to https://www.jsFiddle.net or by clicking here
Step 2: Within in the HTML panel type the following:
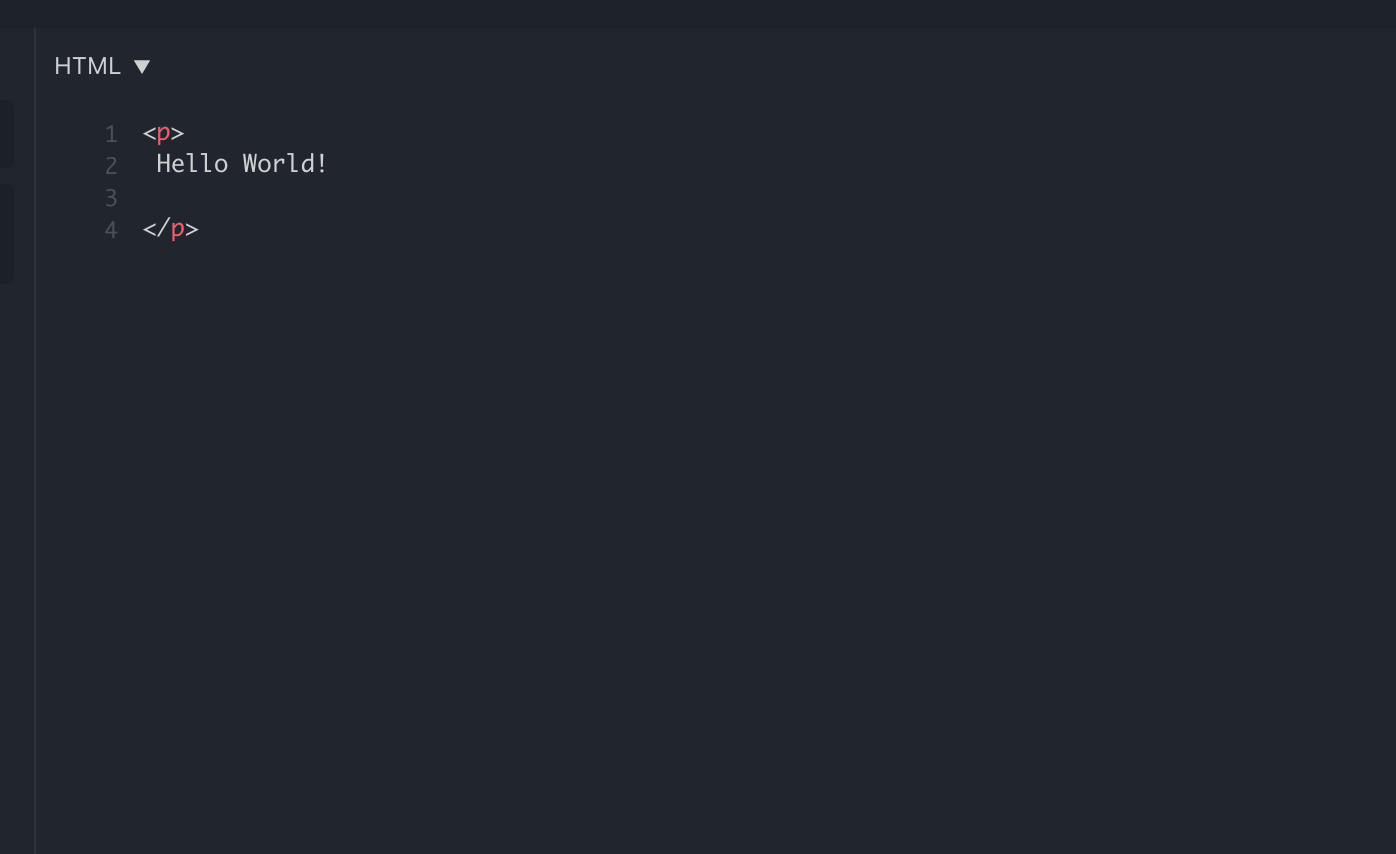
Now press the “Run” button in the upper left corner of the page. Congratulations! You have successfully tested your first program in jsFiddle. Your result will be displayed in the lower right “Results” panel.
Step 3: Now were going to write some CSS to spice up and style our HTML a bit. First we need to give our <p> tag an ID. I choose to give mine the ID “test”, you can name yours whatever you like as long as your CSS styles correspond to the right ID. Now type the following into the CSS panel. 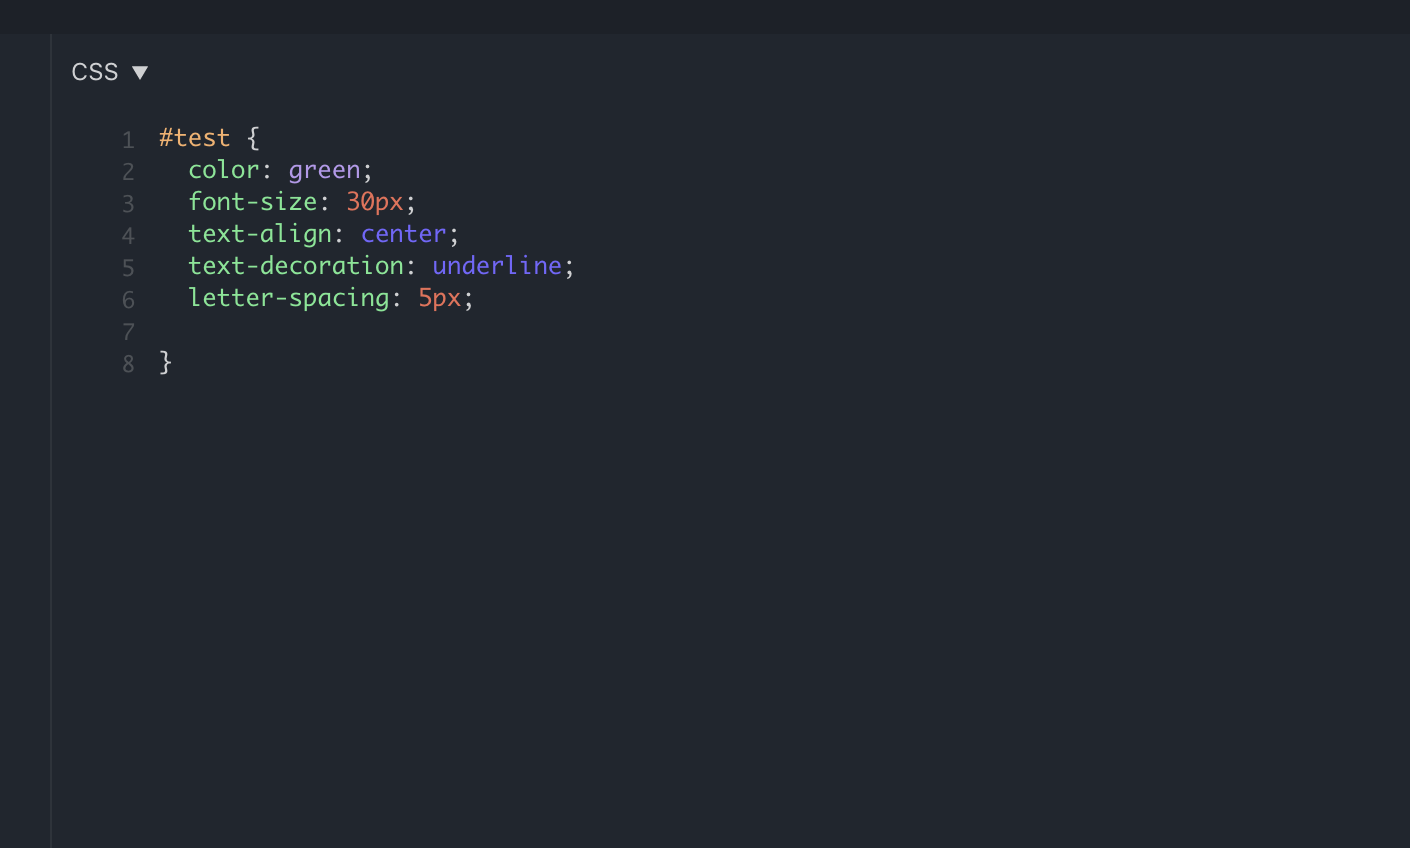
Press run and your previously boring text should be transformed to this!

Now we are going to get really crazy and use some javascript to make our page dynamic.
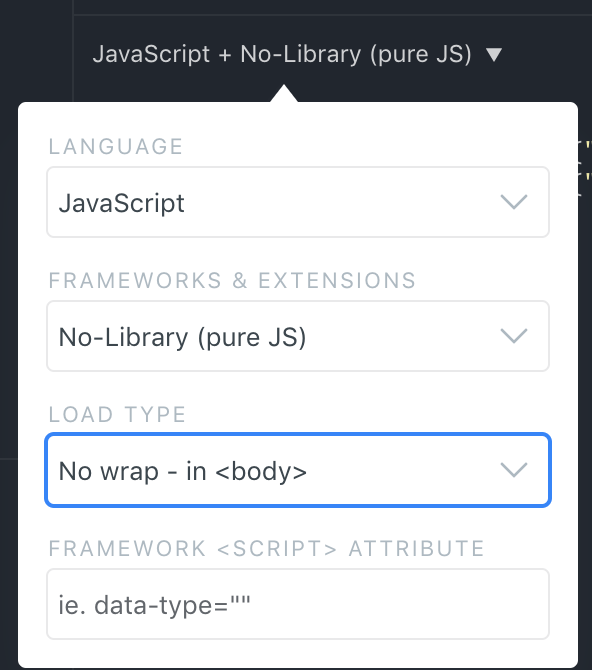
Step 4: First we need to change the load type of the javascript to “No Wrap – in <body>”, this means that our javascript will load in the body of the HTML. To do this we can click the down arrow next to the javascript panel header and select load type to change this.
Now we will create a javascript function and an HTML button that calls our js function when it is clicked.

Click the button to see what happens! Now we have made our page dynamic. In the next part of the tutorial we will explore how how to make a simple chart using the chart.js library.
Tutorial 2: Charts with CanvasJs
Step 1: Our first step will be to create an HTML container for our chart to exist in. To do this we need to write the following code: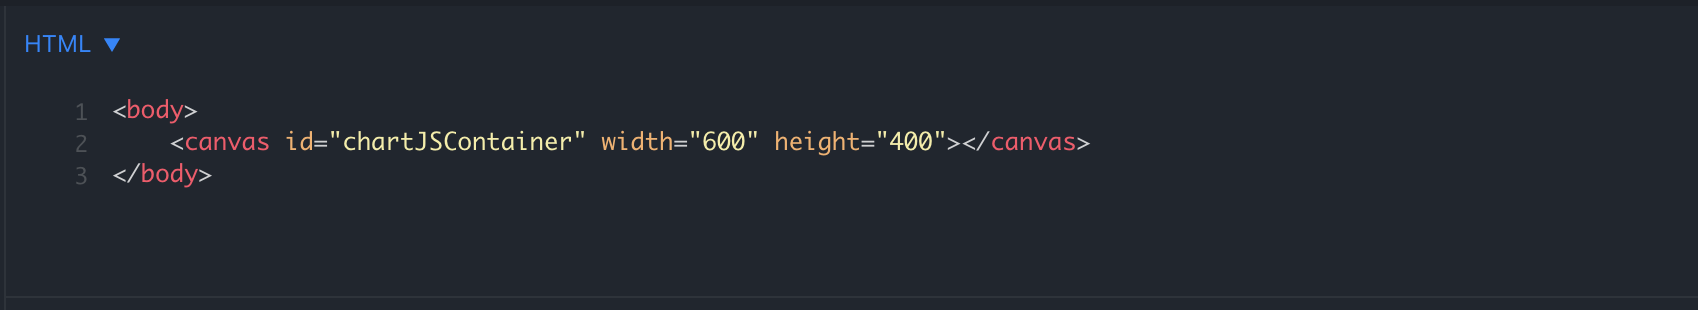
Step 2: Before we start coding our javascript we need to first import the chart.js library. To do this all we need to do is go over to left side of the screen and type in “chart.js” to the resources search bar.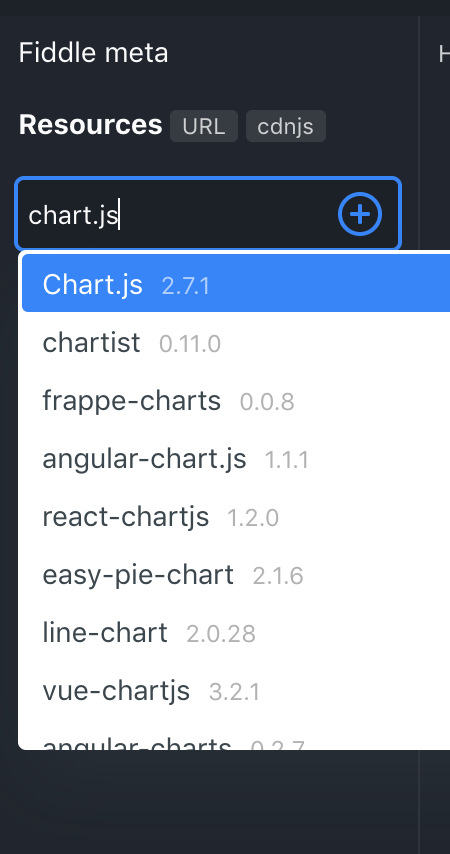
chart.js should appear as an option, click it and now we have this library’s functions.
Step 3: Now we are going to code up our chart. Below is some simple chart.js stock code from their website that has been slightly modified.
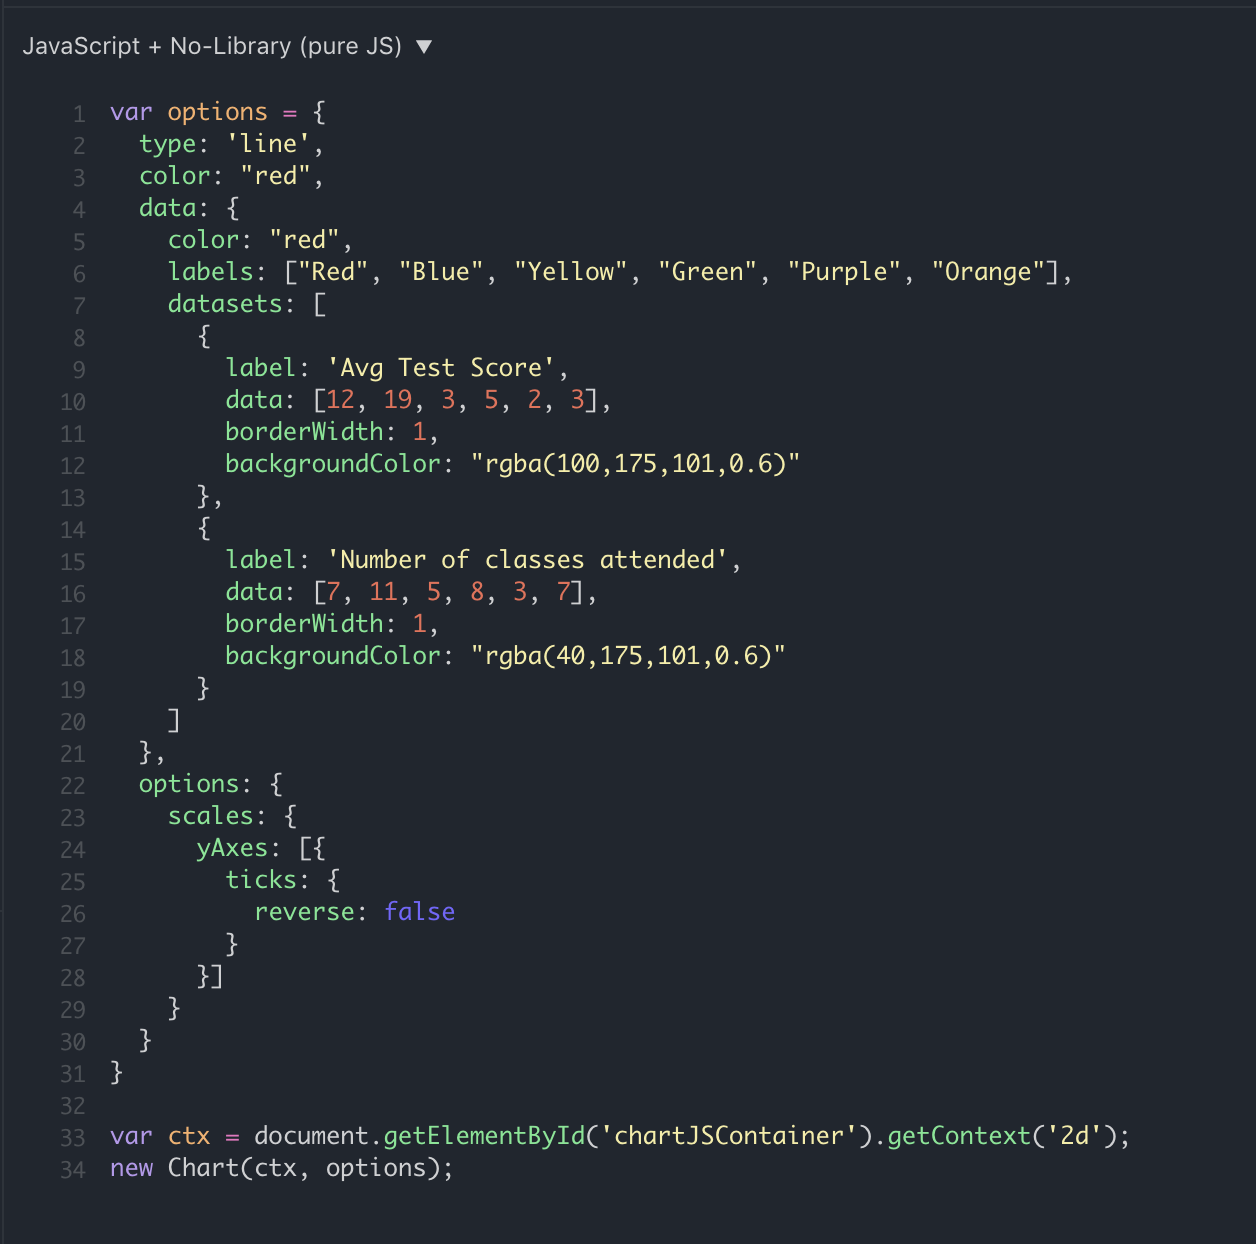
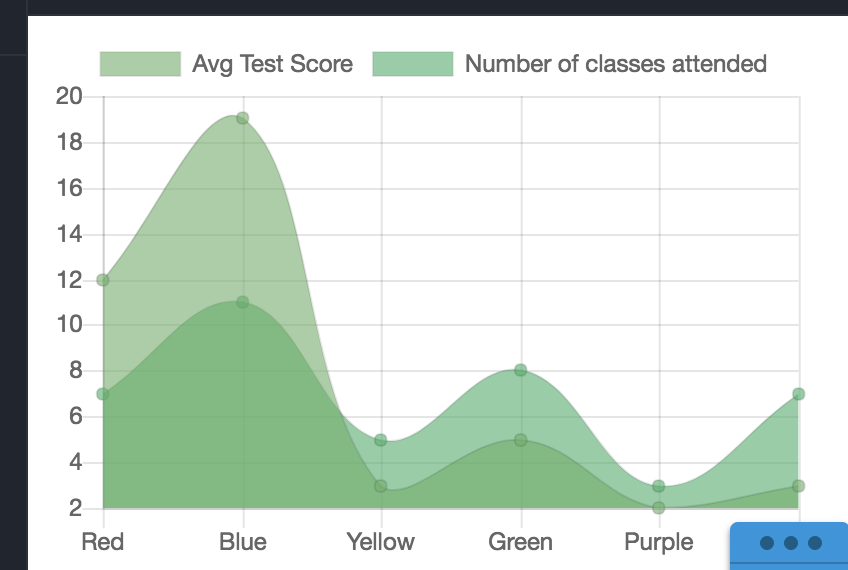
Here are the results! By changing the values in the data structure that creates the chart we can change what our resulting chart will look like. We can put our own values into it by swapping out the current set of values in the “data” list and putting our own information in. We also have the ability to add more lines and change things like color and labels. Feel free to play around with it to get a better sense of how the input data corresponds to chart appearance.
More Information
Interested in learning more? Here are a couple links
chart.js – javascript library used in the demo
canvasJS -another javascript chart library that offers some really cool options.
myFiddle – link to my tutorial fiddle
This is really interesting as I use stack overflow A LOT. I never realized that JS Fiddle was working behind the scenes for many of the questions asked on stack overflow. I followed your tutorials very easily but I am curious as to how you share your workspace? It is also really cool that you can code in HTML and CSS at the same time.