Orange is an open source data visualization and machine learning tool that enables users to create interactive data analysis workflows. On Orange, users can perform data analyses with numerous options for simple visualization, such as box plots and scatter plots, or more complex analyses using heat maps and clustering. Luckily, users don’t have to spend so much time on coding for a rule or a graphic visualization, since every programming done on this platform is visual, which makes it easier for digital humanists with little background in programming to visualize their data. Instead of scripting lines of codes, users just can pick the type of analysis or visualization they desire that is available in a large toolbox. Then, they can choose which datatype goes through which analysis or visualization by connecting the data to the tools in a single workspace which is totally scripting-free. Overall, Orange is a great tool for any digital humanist with a big data (metadata) in hand who is curios about what type of analysis and visualization they can do with their data.
On this tutorial, I will show how to create different types of diagrams (a scatter plot, a distribution plot, and a Sieve diagram) using this tool.
STEP 1: INSTALL ORANGE AND CREATE THE WORKFLOW
Visit the website and download Orange. Install the application to your computer, and then launch it.
Create a new workflow by clicking New on the starting window. Enter the title and the description of your workflow.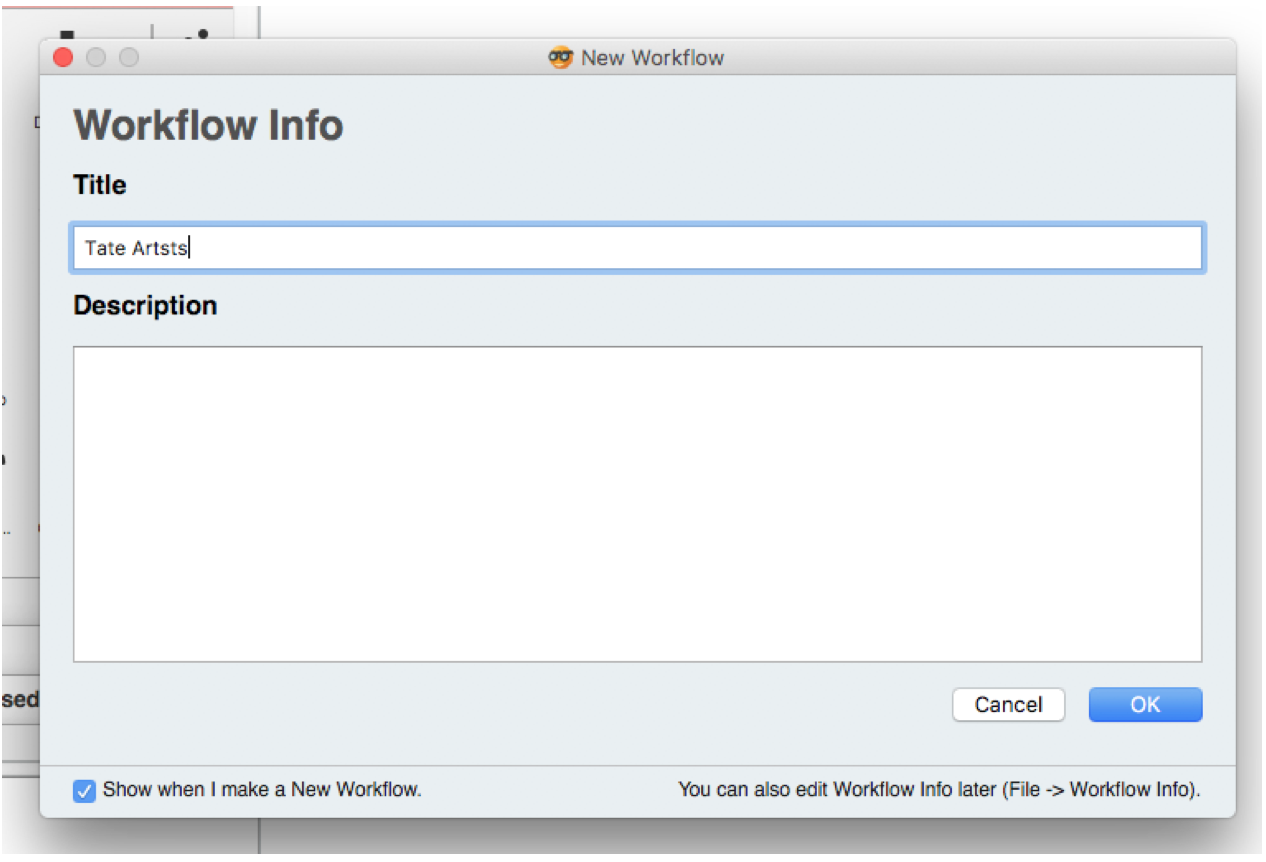
STEP 2: UPLOAD YOUR DATASET
Navigate through the large toolbox on the left. There are five classes of action you can perform in the toolbox: Data, Visualize, Model, Evaluate, and Unsupervised.
- On Data, you can upload, edit, and randomize your dataset.
- On Visualize, you can intuitively visualize different datatypes in your dataset.
- On Model, you can create a prediction based on your data, run an algorithm on your data, and create trees and regression models based on your data.
- On Evaluate, you can calculate statistical values, perform PoCA analysis and other types of statistical analyses.
- On Unsupervised, you can train your model to achieve certain goals and basically perform some machine learning to help your analyses.
For our purposes, since we don’t need to model or simulate anything with our data, we will solely focus on Data and Visualize. Now, click on the Data tab. Here, you see that we can do so much with our data once we upload something into the workspace. For the reason of simplicity, we will just let Orange automatically read our data without any further processing. However, you can explore the other commands by following the youtube tutorial I link to below. Then, to upload a file, click File, so that a File icon appears on the large white workspace (circled).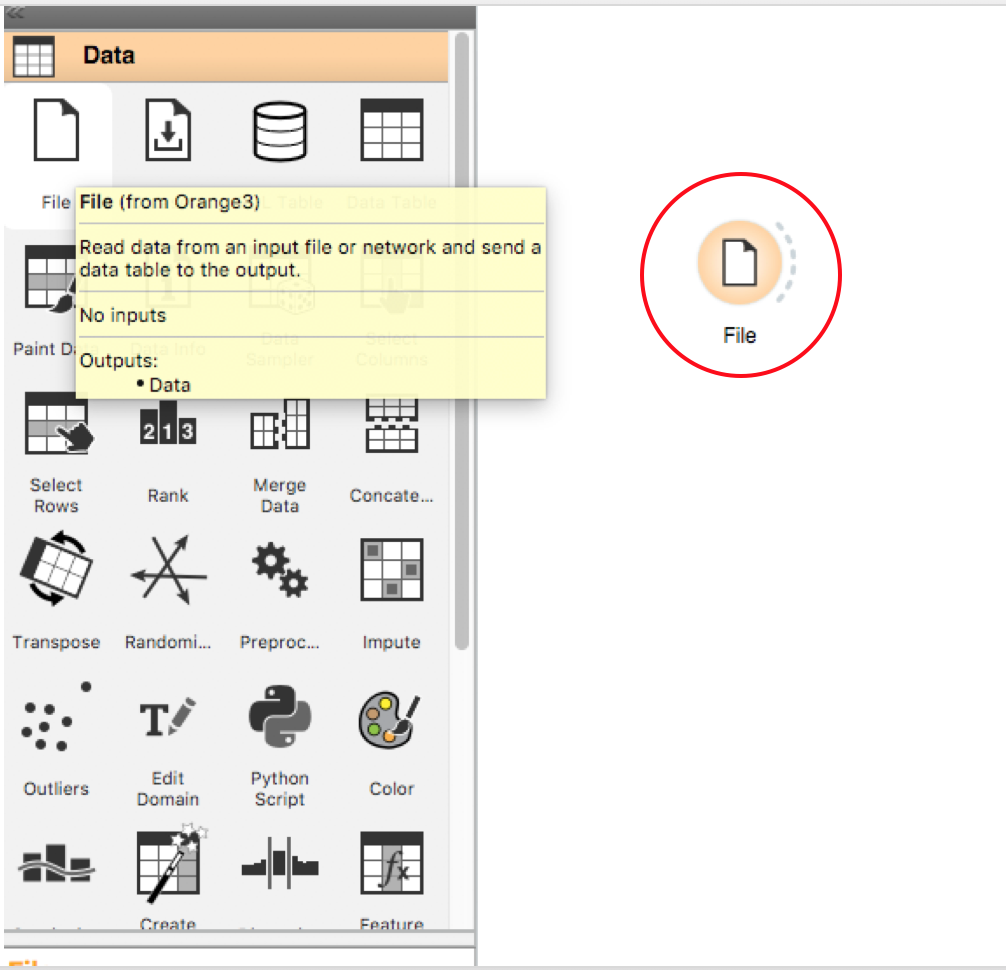 Next, double tap on the File icon in the workspace and upload the file containing your dataset (in this case I uploaded the Tate Artists dataset from the midterm).
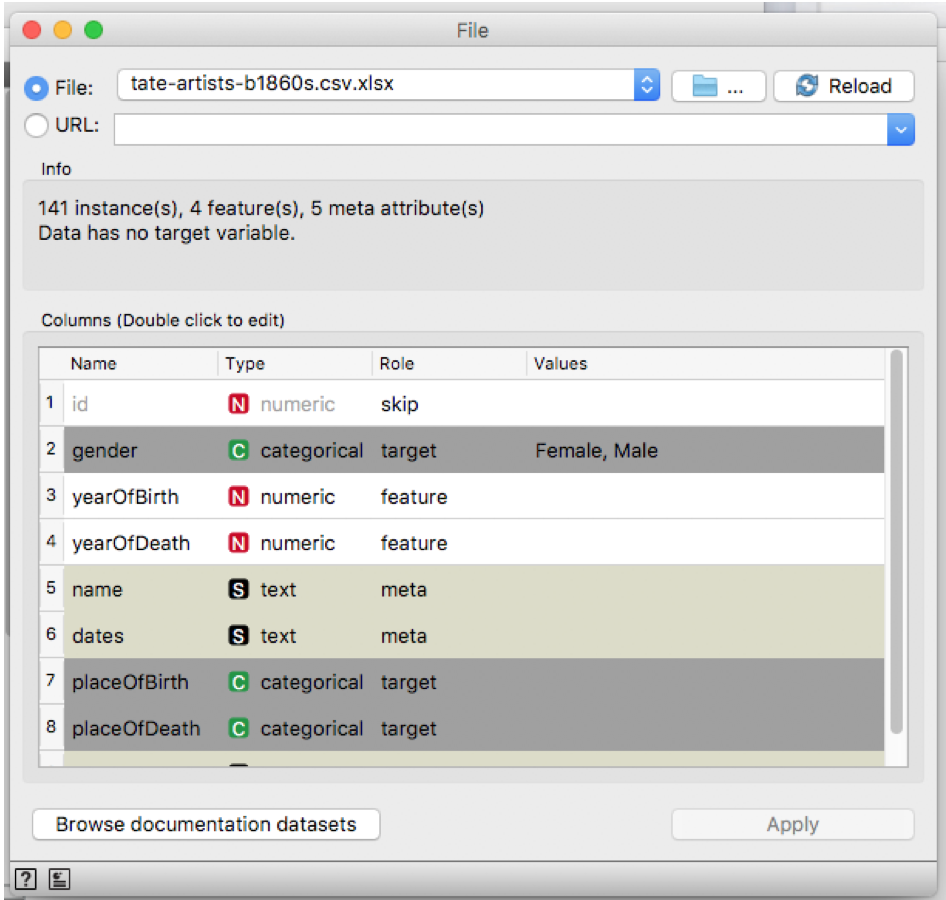
The File window will appear on your screen. By now, Orange has read your dataset and found some datatypes based on the column organization in your .csv file. This window shows you what Orange “thinks of” your dataset. Your task now is to adjust the name, type, and role of each datatype. The type of your data can be numerical (for numbers), categorical (for categories; e.g. male or female), or text (for names, places, texts). Ideally, Orange gives a great suggestion of role for each datatype, but, of course, you can always modify this assignment. You can skip a data if you don’t want to use it in your analysis. For example, here I don’t really want to include id in my analysis; so, I just skip it. On the other hand, target and feature roles are generally the ones used in an analysis. If you make any change on the dataset, click apply and close the window.
STEP 3: VISUALIZE YOUR DATA
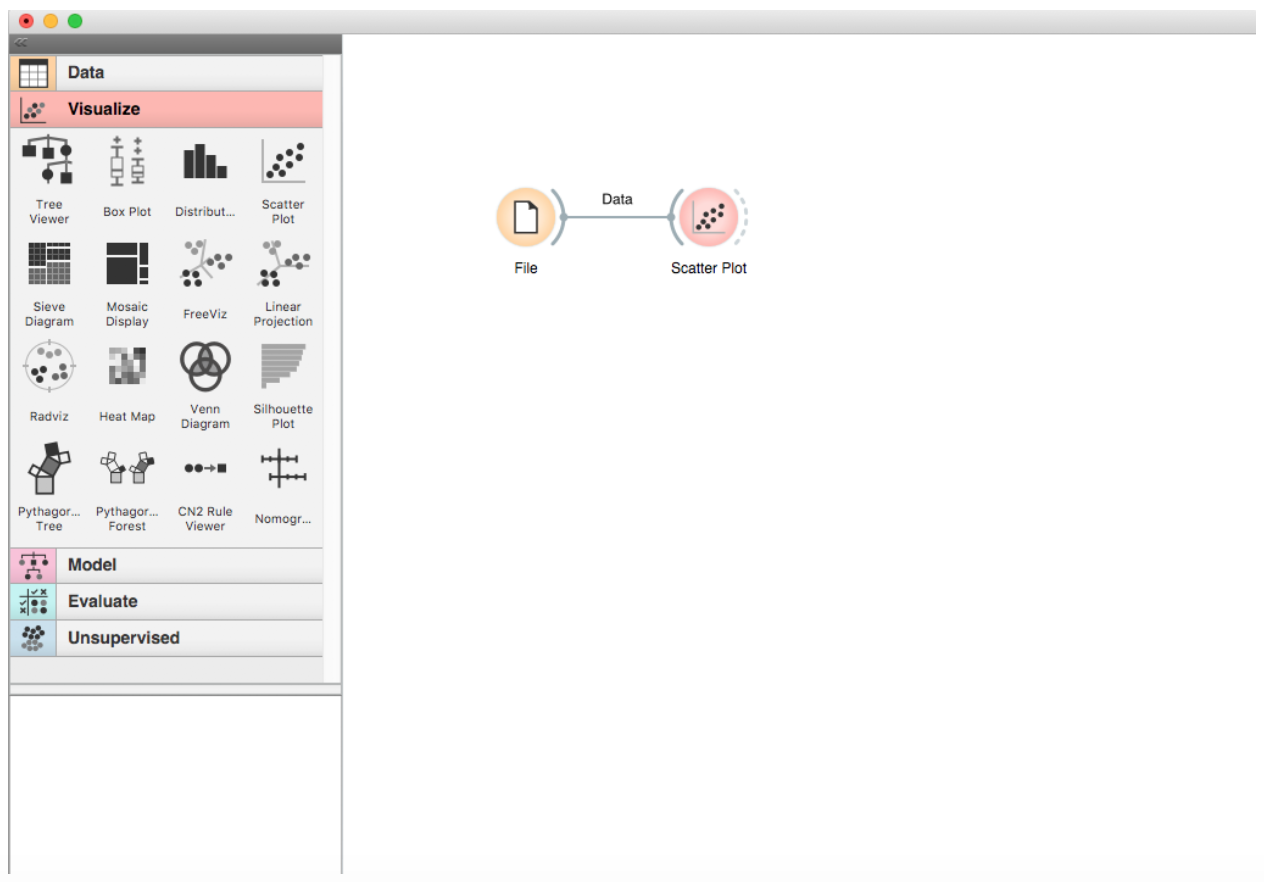
Pick the data visualization that you want on the visualization tab. For this tutorial, I first pick the scatter plot. Now, you have two icons on the workspace: the File and the Scatter Plot. On the dashed lines to the right of the File icon, drag the cursor to create a line connected to the Scatter Plot icon. Voila! The dataset in the File is now “stored” in the Scatter Plot workflow.
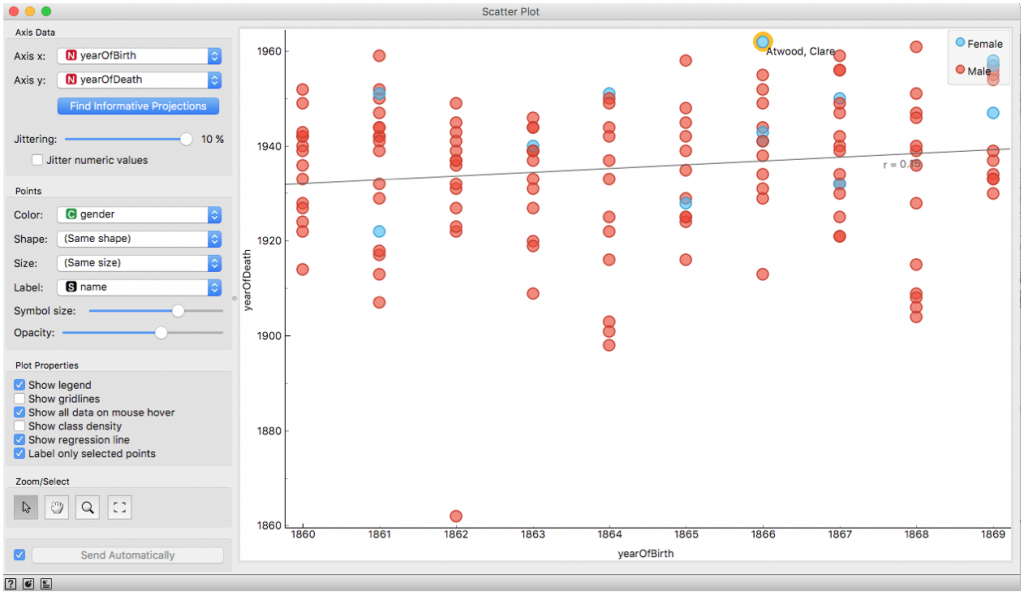
To create the scatterplot, double click the Scatter Plot icon, and a Scatter Plot window will show up. You can change the x- and y-axes as you wish. You can also show a regression line to assess correlation between your x- and y-axis values, just as in Excel. With Orange, however, you can color-code or shape-code your data points based on a specific category you assigned on the previous step. For example, I just separated the artists based on their gender. Further, you can easily change the shape of a data point and you can label the point as you wish.
Note: Here, I just showed that there is no significant correlation between the artist’s year of birth and their of death (r=0.15).
STEP 4: USE OTHER TYPE OF VISUALIZATION (OPTIONAL)
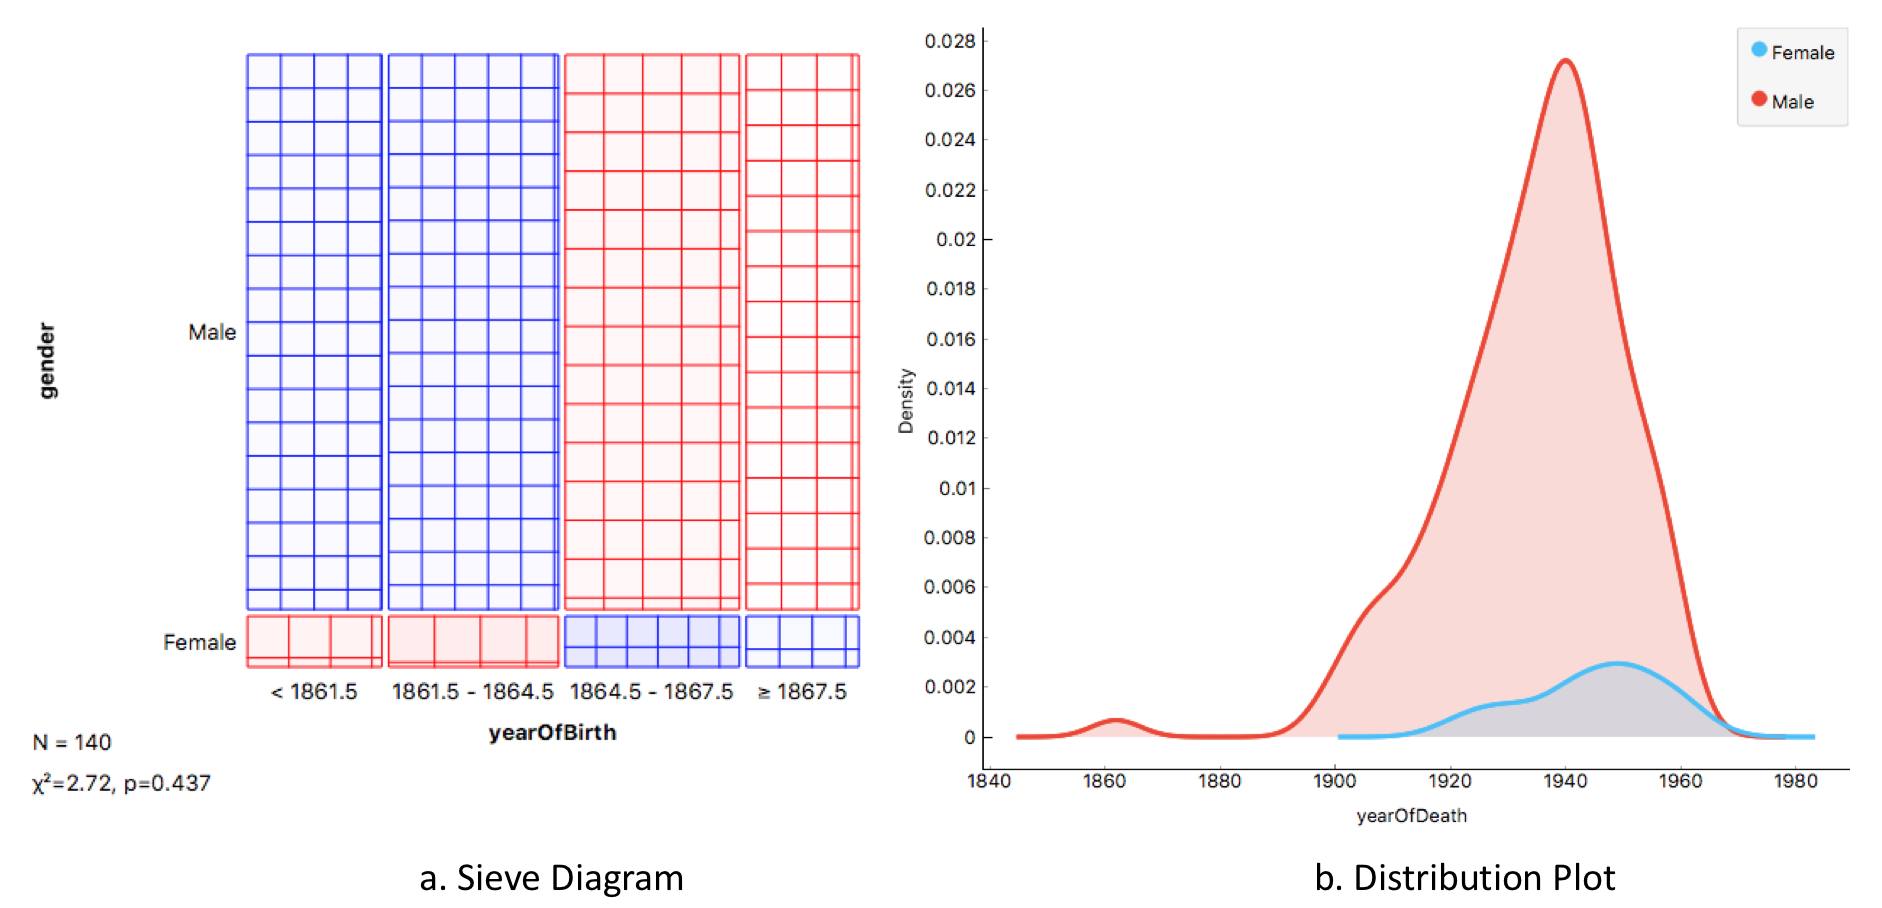
Now, you can pick other types of visualization, such as distribution plot and Sieve diagram (if you don’t know what a Sieve diagram is, read about it here). You just need to repeat STEP 3, but now using different a visualization type. So, instead click on the Scatter Plot at the toolbox, you clock on either Distribution or Sieve Diagram icon. This means your single dataset can now be visualized in three ways using the same workflow.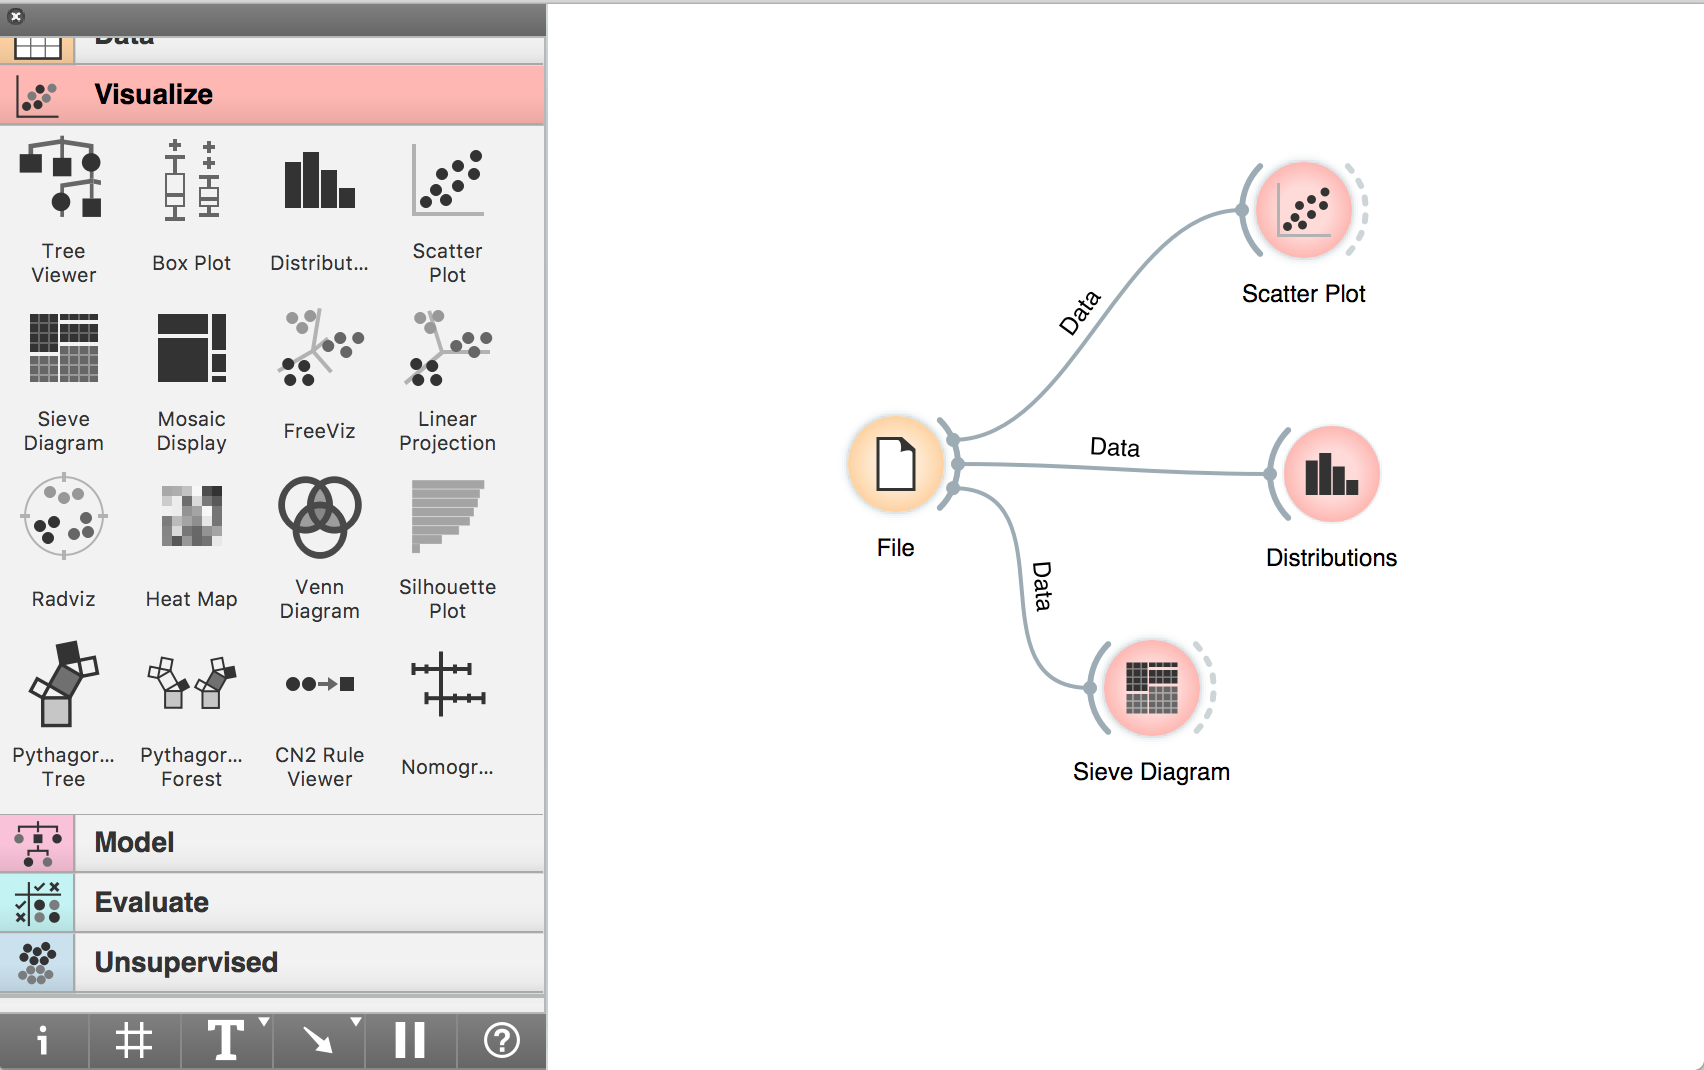
STEP 5: SAVE YOUR FIGURE(S) AND YOUR WORKFLOW
You have create different visualizations of your data, and now you might want to save those visualizations into your computer. To create a figure of your visualization, click the save button at the bottom of the visualization window. Type the title and choose the type of image you want to produce. Click save. 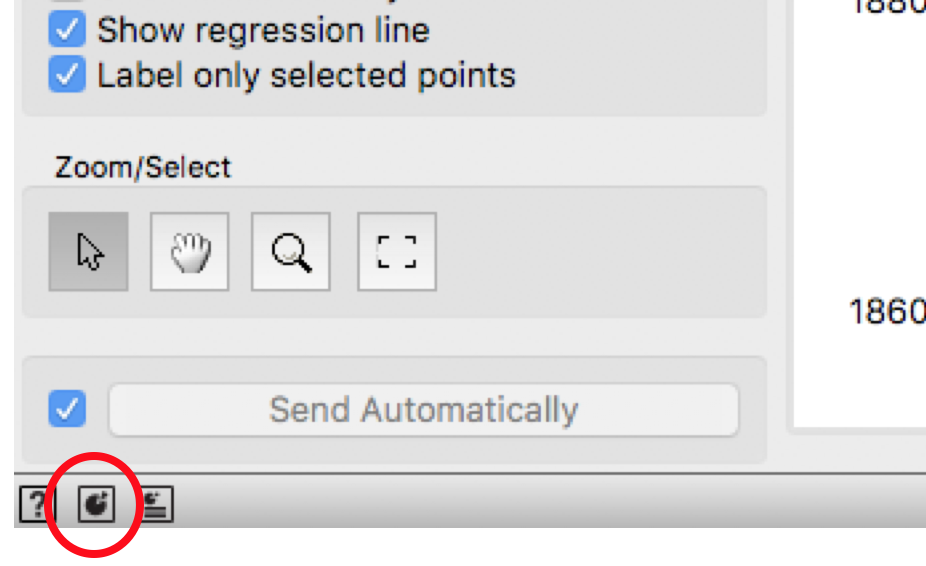 Congratulations! Now you have created not only one, but three figures from your single dataset. Look at the beautiful figures we just created below.
As I mentioned earlier, this tool can help you create even more complicated visualizations and do some data mining (without having to code on R or script in Python). Orange is also really generous with its comprehensive youtube tutorial. Additionally, here is a tutorial on building a machine learning model using Orange. Enjoy!
This seems like a very intuitive workflow with a lot of visualization options. What limitations (if any) did you find with this software when creating this tutorial?
I haven’t really explored that much. The website claims that the software can do a lot of things, but I am pretty sure it might not be as powerful as other statistical analysis tools like RStudio or Matlab.
I also viewed this tool when browsing DH programs for the tutorial. Seems like a great tool that has a large amount of options for viewing and organizing data. Is there a way to publish a project using a collection of these tools to cleanly display a data set?