StoryMap JS is a wonderfully intuitive tool for creating multimedia projects that link locational information with text and images to create maps that can act as story-telling devices or timelines. StoryMap is great for showing complicated series of events that can be broken down into location- and time-linked chunks, such as depicting the journey of a traveler, like in this example which shows Arya’s travels in Game of Thrones. Sometimes, useful StoryMaps can be created without temporal data. However, StoryMap won’t be useful if you’re missing geographic data: you might want to try Timeline JS instead.
Now that you know when StoryMap JS is useful, let’s get started.
Step 1: Setup
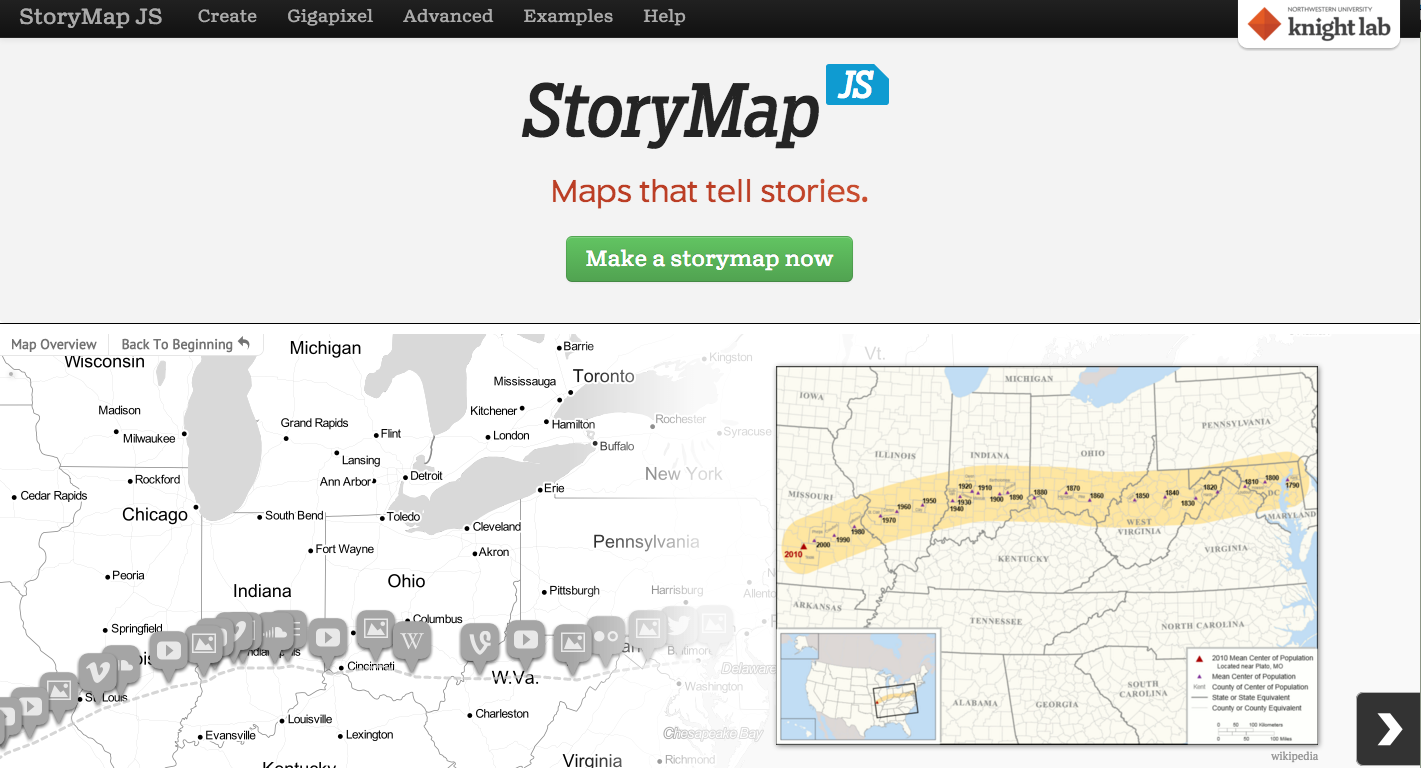
Go to StoryMap JS and select the big green button in the center that says “Make a storymap now”
Once you’ve clicked on the button, you’ll be prompted to sign in to your Google Account. (If you don’t have one, set one up now!)

After you log in via Google (which links your StoryMap to Google Drive as well, which can be quite helpful),
you’ll be prompted to chose between two options: a Map, and a Gigapixel.
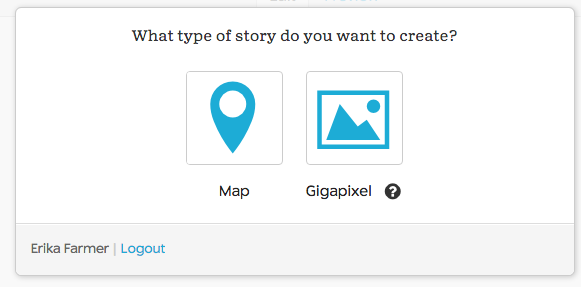
For most purposes, especially when you’re getting started, you want to chose “map.” Gigapixels allow you to upload your own image or map, instead of using the Google map provided in the “map” default. This might be useful if you want to work off of a historical map, or a map of a fictional place (such as the Game of Thrones example, which was done using Gigapixels). However, for this tutorial we’ll select “map.” You’ll be prompted to title your map, and press “create.” Now the setup is done!
Step 2: Create a Title Slide
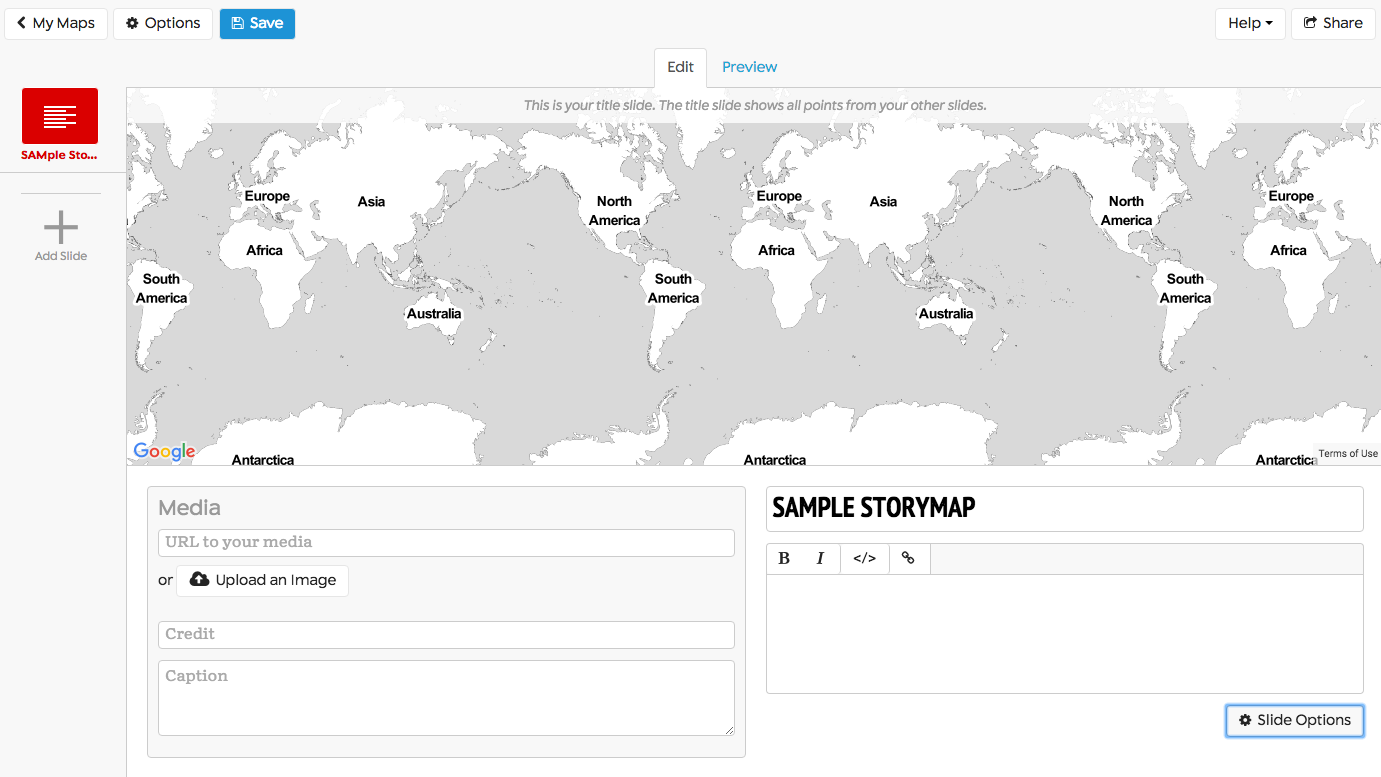
The title slide of you StoryMap is going to be what anyone looking at the map sees first. On the finished product, the first slide will show a map with points marking all the different points your StoryMap has slides for, as well as the title and any photo or text you have on the first slide. For now, be sure to put the title of your StoryMap in the text box marked “headline” (which now reads “Sample StoryMap” in the example photo). We can add more to the title slide later.
Step 3: Create Individual Location Slides
Start by clicking the “add slide” button on the left side of the window.
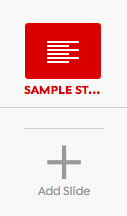
You should now have an untitled slide that looks like this:
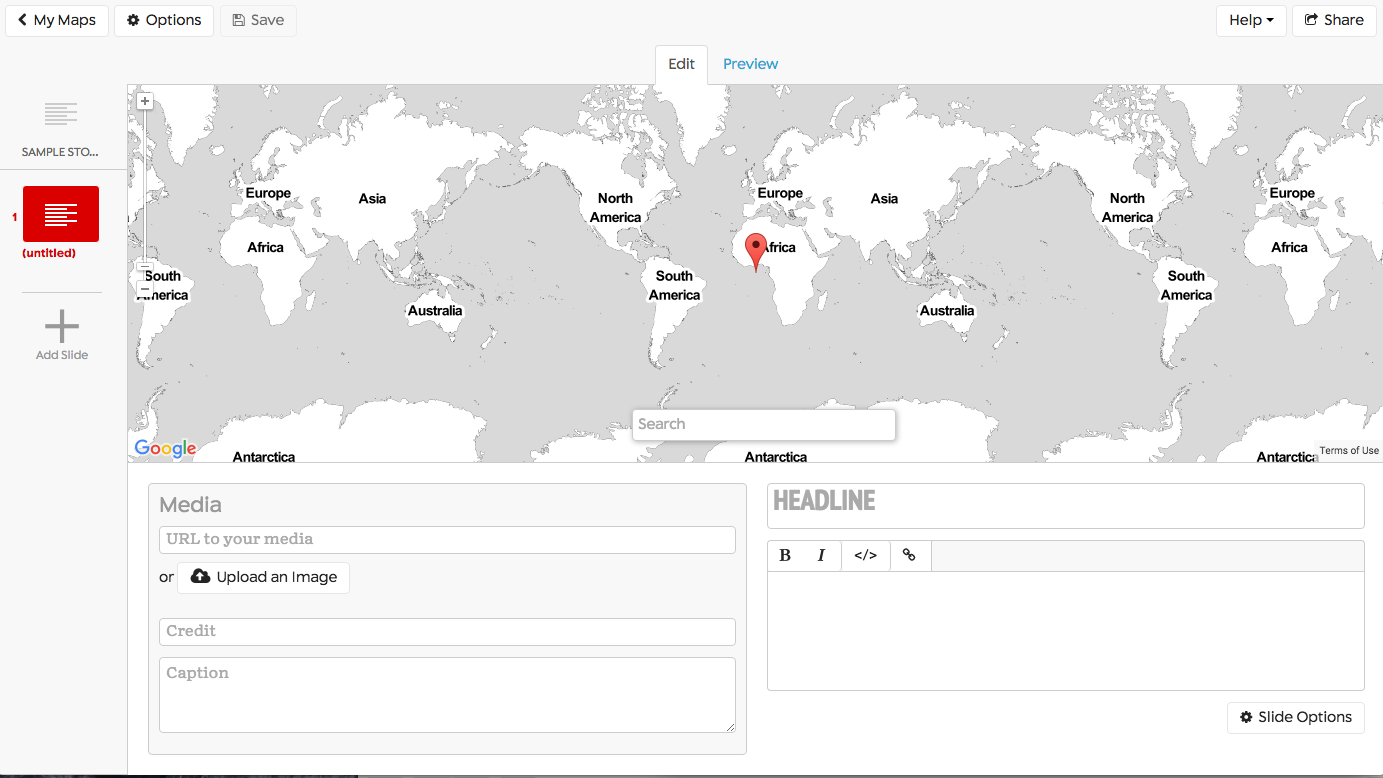
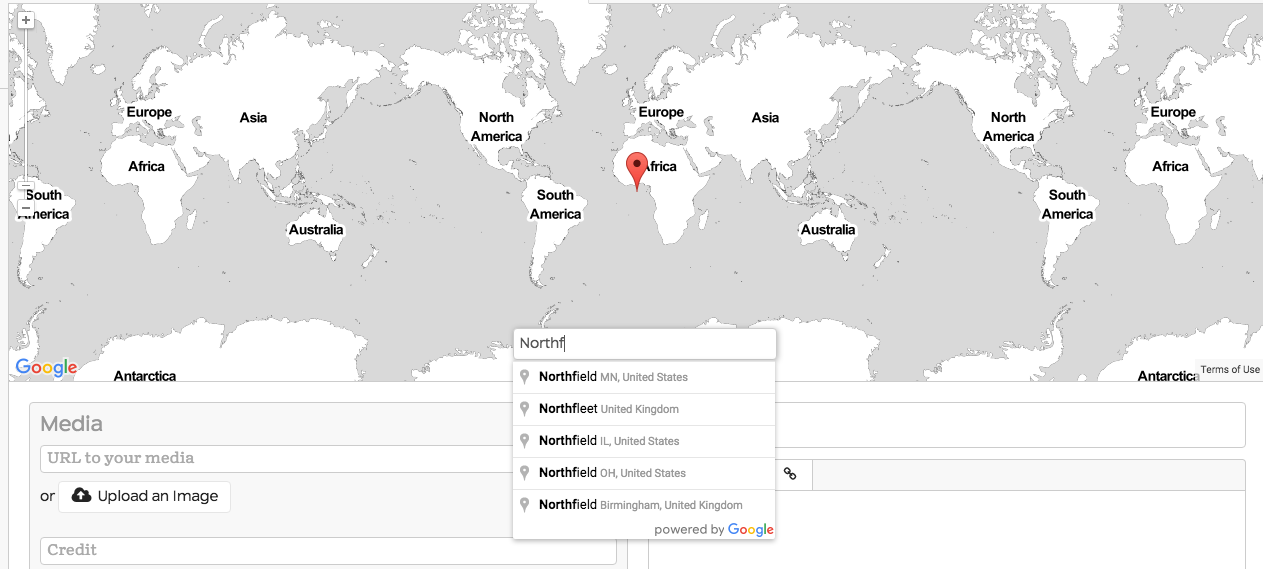
This slide doesn’t look too different from the title slide we saw in step 2, but there are a few differences in how this slide functions. Most importantly, you need to set a location for the slide, which can be done by dragging the orange location marker on the map, or by using the search bar at the bottom of the map. I recommend the search bar, because it is much more accurate. For example, let’s search for Northfield, MN.
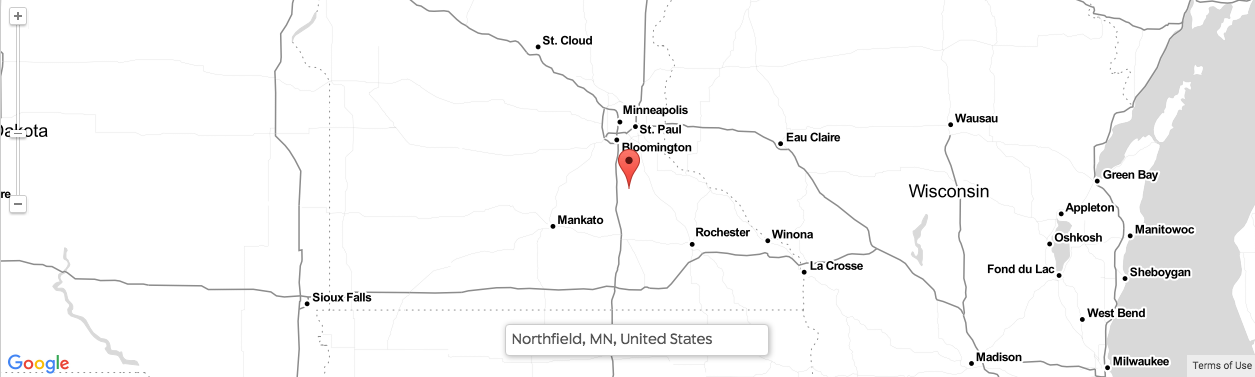
Once we hit return to run the search and zoom in using the zoom function on the left side of the screen, we see that the location marker is on Northfield.
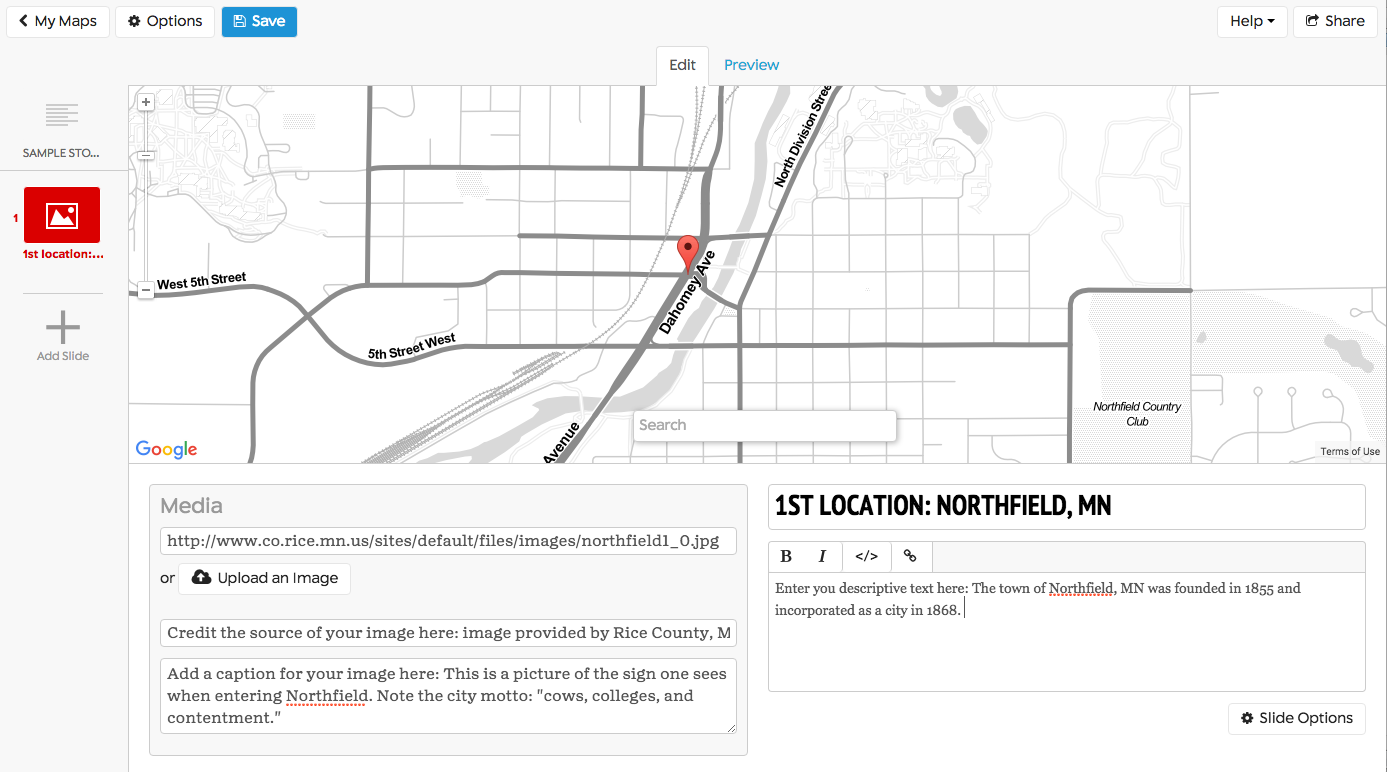
Now that your slide has a location, there are various other pieces of data you can put it, as show in the next picture.
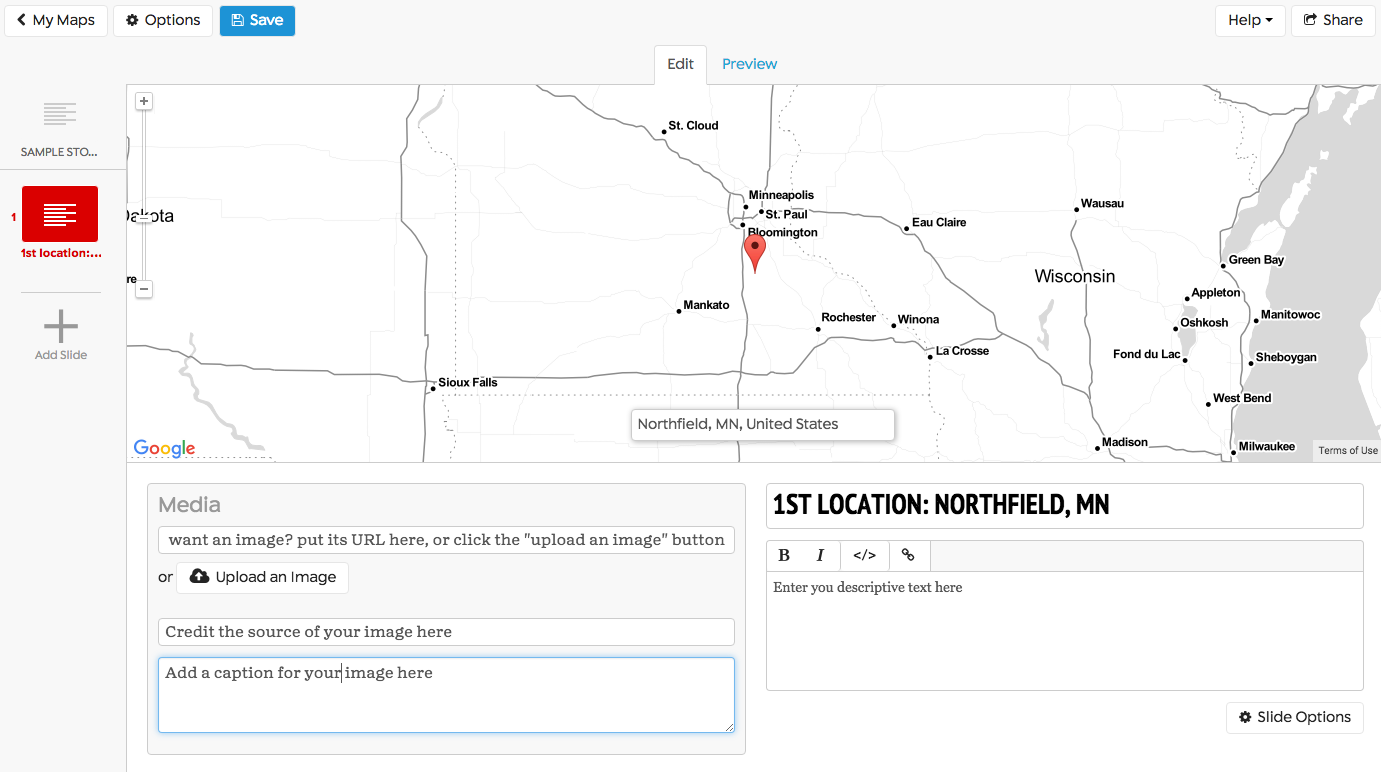
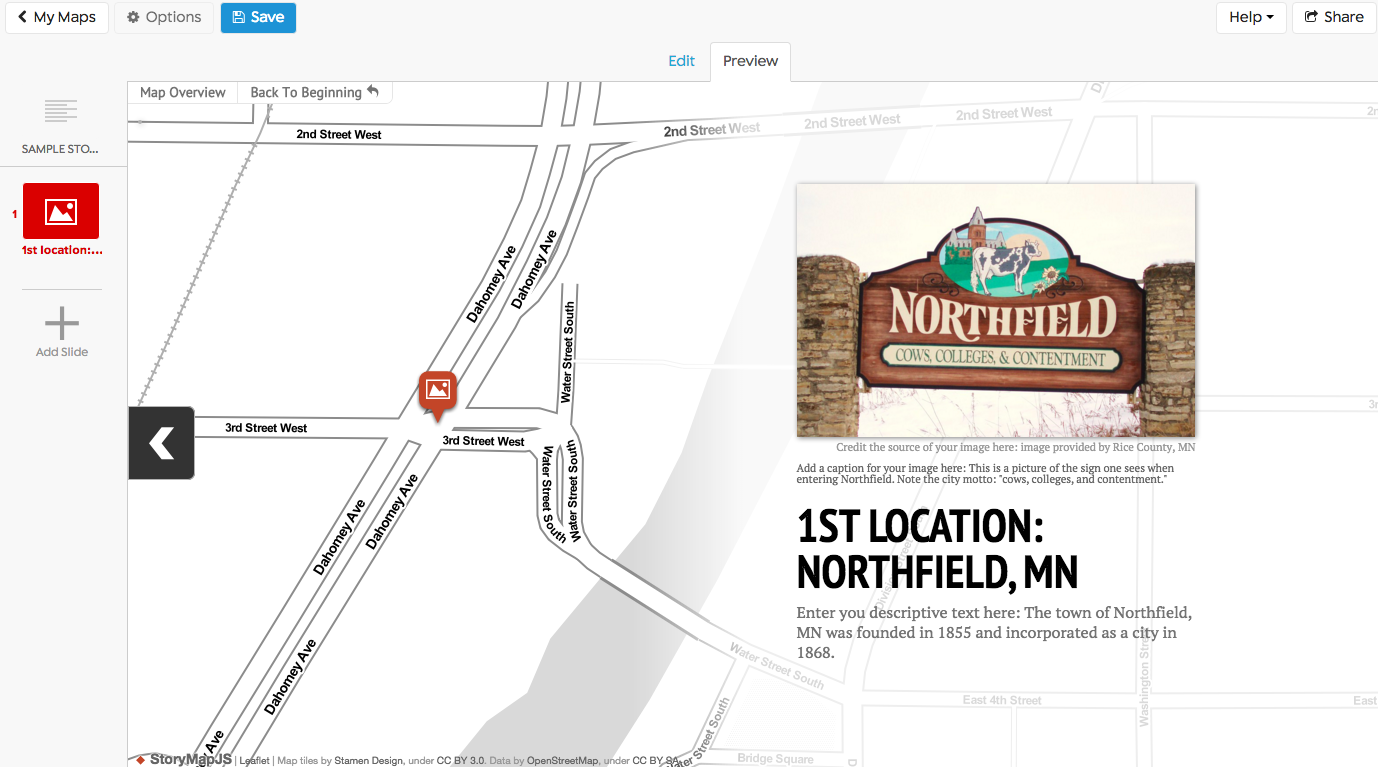
Make sure to once again add in a title for the slide, along with descriptive text and possibly an image. Below, you can see what a mockup of the first slide might look like, first in “edit” mode, then when “previewing” the final, which can be accessed by clicking on the blue “preview” tab at the top of the page. Note that in the main text box, you can add links and formatting to the text.
Step 4: Create the Other Location Slides
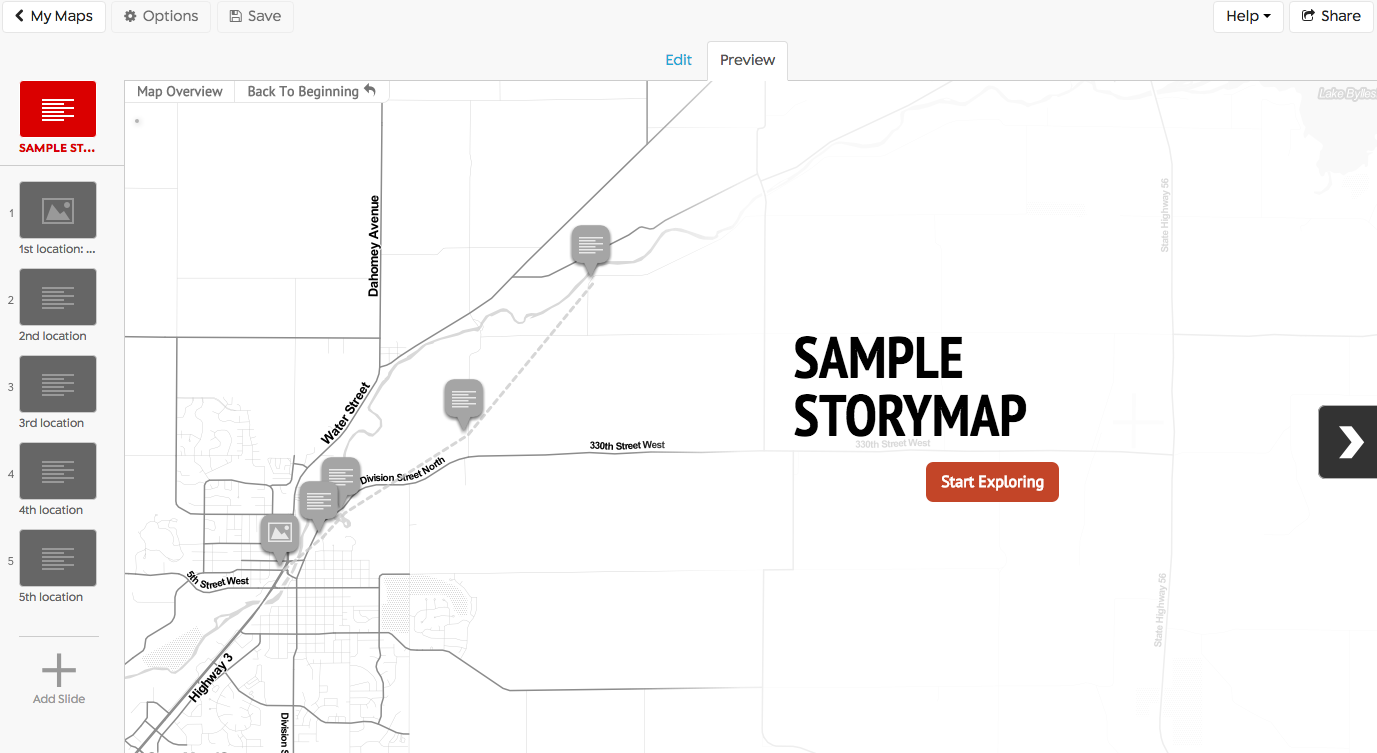
Following the same set of steps as above, create your other location-based slides. Ideally, organize them in a way that follows a logical progression, be it over a course of time, or following a path. Remember that the path of your slides will show up on the title slide once you’re done. For an example, you can see the preview of a title slide with multiple location slides below.
Step 5: Further Customize Your StoryMap
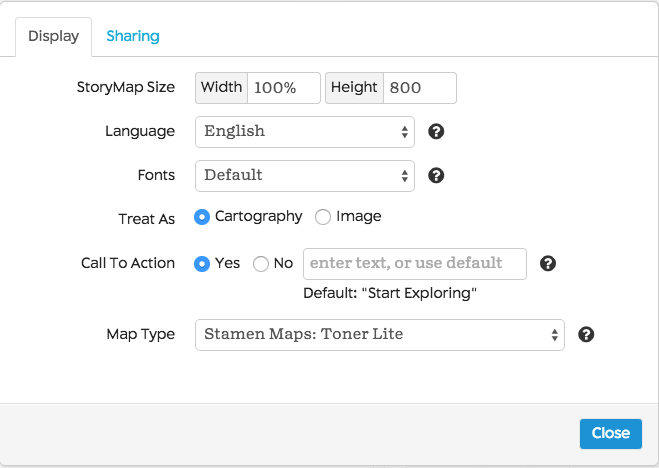
Customize all of the slides by choosing the “options” button at the top left, which will bring you to a screen that allows you to make thematic changes, such as changing the font, language, or map type:
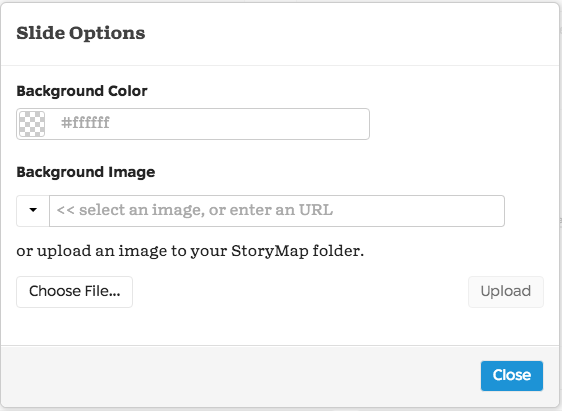
If you select the “slide options” button at the bottom right of the page, you can change the background color or set a background image for that particular slide.
The final bit of customization I’d suggest would be to add different types of media. While pictures are the most obvious media to add to your StoryMap, you can also link to webpages, embed videos, and add audio.
Step 6: Share and Publish Your StoryMap
Luckily, sharing your finished product is very easy: you either embed it in another website, or post an individualized link to the StoryMap. Click on the share button at the top right corner and this window will pop up:
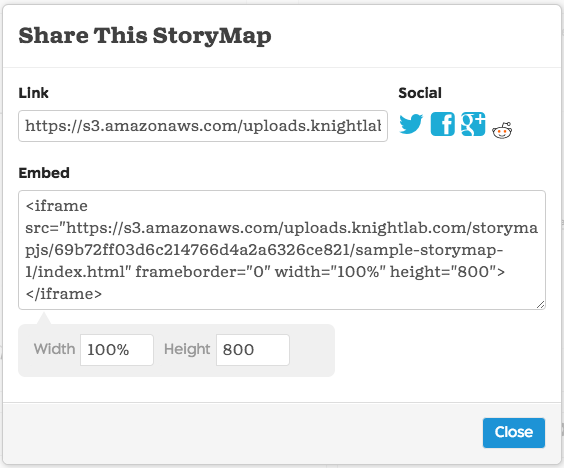
Then, simply copy and paste either the link or the code to embed the StoryMap into a webpage, and you’re ready to share it!
This should be enough information to get started, but if you want to see a screencast that demonstrates basic (and some not so basic) functionalities of StoryMap, I highly recommend this one from Macalester College’s Digital Humanities Program. Otherwise, some of the best help with StoryMap JS can be found on the knightlab forums dedicated to it, or for a more technical look, go through the StoryMap JS GitHub repository.
Happy mapping!
One Comment