What is TimelineJS and why should I use It?
TimelineJS is an open-source tool that allows users to create easy-to-make, beautiful, interactive timelines. Timelines are great visual aids to any DH project, particularly those involving history! Not yet convinced? Here is an example of a finished product:
Are you now convinced? If so, follow me through a tutorial on the tool!
Step 1. Choose your topic and read through these guidelines for making a timeline
For our walkthrough, we will follow the important contributions women have made to computer science.
Tips for making a timeline:
- Less is more; It is recommended to have no more than 20 slides for a reader to click through
- Pick stories that have a strong chronological narrative. It won’t work as well if a story jumps around in the timeline
- Write each event as a small part of a larger narrative
- Include events that build up to major occurrences (rather than just the major ones on their own)
Step 2. Create a Google Spreadsheet using the TimelineJS template.
a.) To get started, simply click the link above to access the template
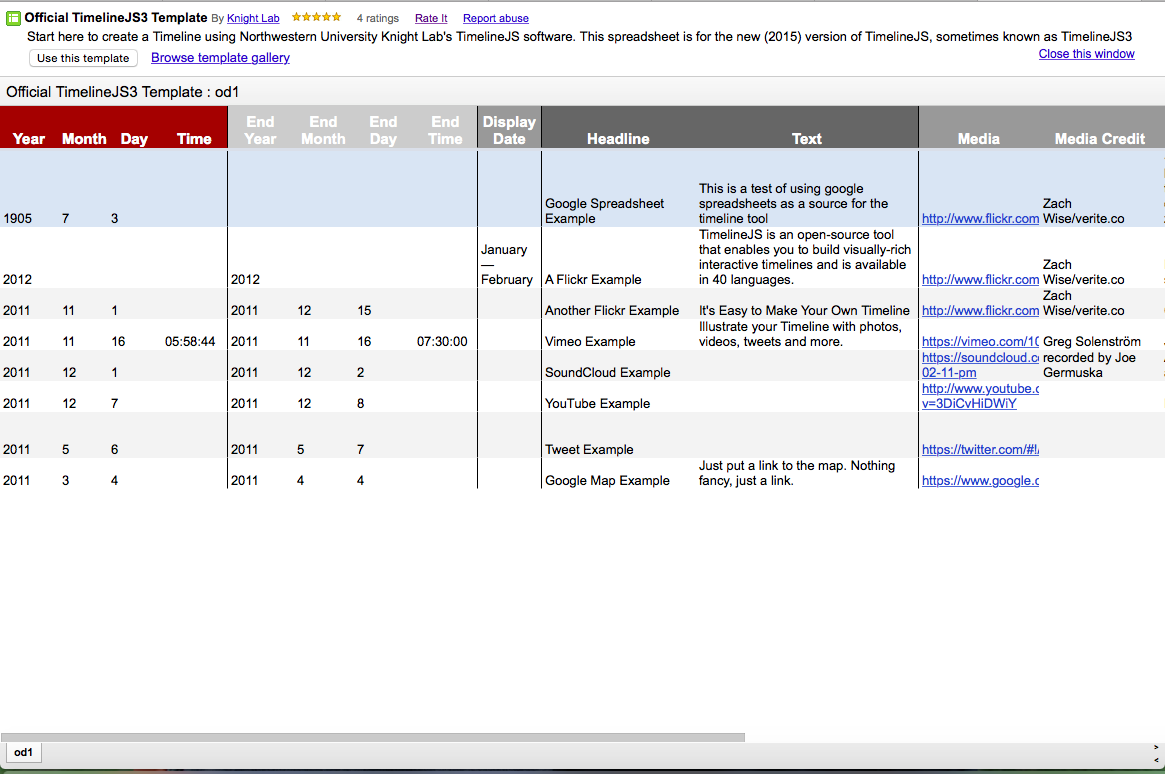
The TimelineJS template
b.) Copy this to your Google Drive by clicking the “Use this Template” button in the top left corner. Once it’s yours, make sure not to change any column headers, don’t remove any columns, and don’t leave any blank rows in your spreadsheet.
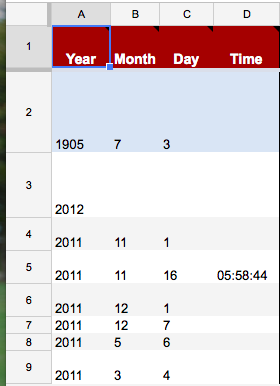
c.) Add your starting dates. The first four spreadsheet columns (A-D) are the date of your timeline entry. You must enter at least the year, but you can also include month, day, and time. Add a display date in column I. To enter BCE dates, use a negative year. For example, if I wanted to say an event took place in 500 BCE, I would enter -500.
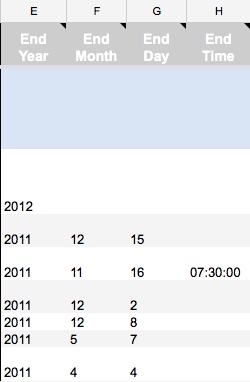
d.) Add your end dates (optional). The second four columns (E-H) are the end dates of your timeline entry. Like your starting dates, you must enter at least the year, but you can also include month, day, and time. Adding end dates will allow TimelineJS to display spans of time (eras) in the bottom portion of the timeline.
e.) Add content. Columns J and K contain the headline and the body text that will be displayed one each slide of your timeline.
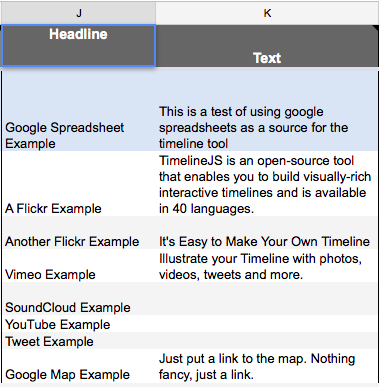
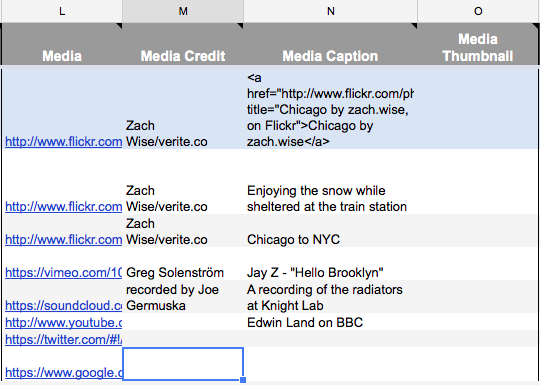
f.) Add media. This can be done in columns L-O. TimelineJS works on any website or blog and can take media from a variety of different sources. This includes:
- Google Maps
- Flickr
- SoundCloud
- Vimeo
- Vine
- Wikipedia
- Document Cloud
- and many more!
For more information about compatibility of media sources see TimelineJS’s guide to using spreadsheets
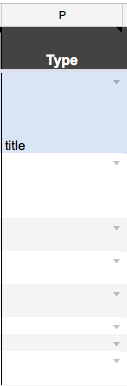
g.) Add Titles and Eras. You can use the Type column (P) to activate a few more specialized features in your timeline. This includes the title option. If you use the word title in this column, then your Timeline will use the row as a “title slide,” which is shown before all others and does not require a date. Title slides also will not appear in the markers in the navigation section of the Timeline. You should only have one row with “title” in the Type column. This also includes the era option. If you use the word era in this column, your Timeline will use the row to label a span of time in the axis area of the timeline navigation. If you don’t want to use any of these features, you can leave it blank.
h.) Use CSS to style your timeline
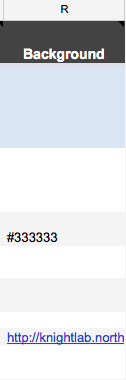
To find the colors you want to use, look at a color hex values table and select it’s code (it will have a # and 6 digits), visit this link to browse through your options and learn more:
Publishing your Timeline
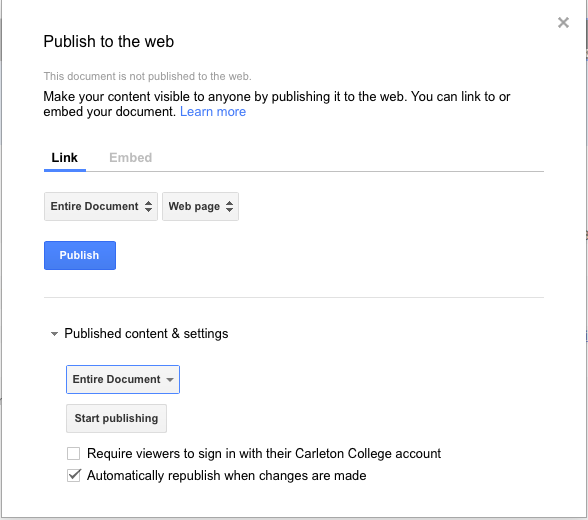
- Go to the File menu of your Google spreadsheet and click “Publish to the Web”

a.) In the window that pops up, make sure you select:
- Link (this should be the default option)
- “Automatically republish when changes are made”
- “Entire Document”
- Optional: if you only want Carleton students to view your project, select “Requires users to sign in with their Carleton account”
if you are using Google Apps for Work or Google Apps for Education, this may not work without the cooperation of your local Google Apps administrator, even if you follow the steps exactly.
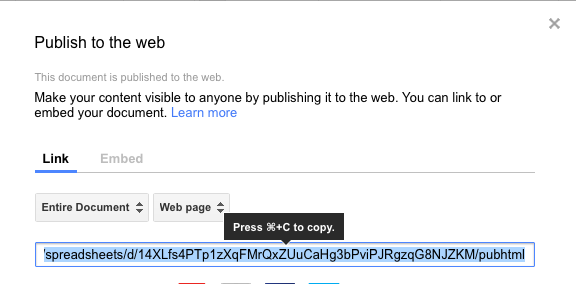
- Copy the link
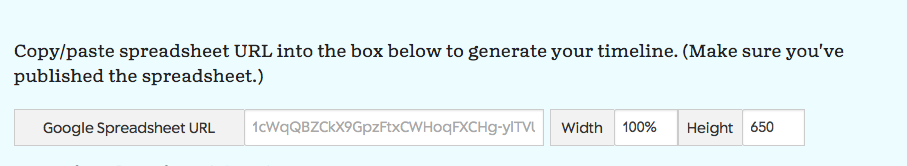
- Open the TimelineJS website
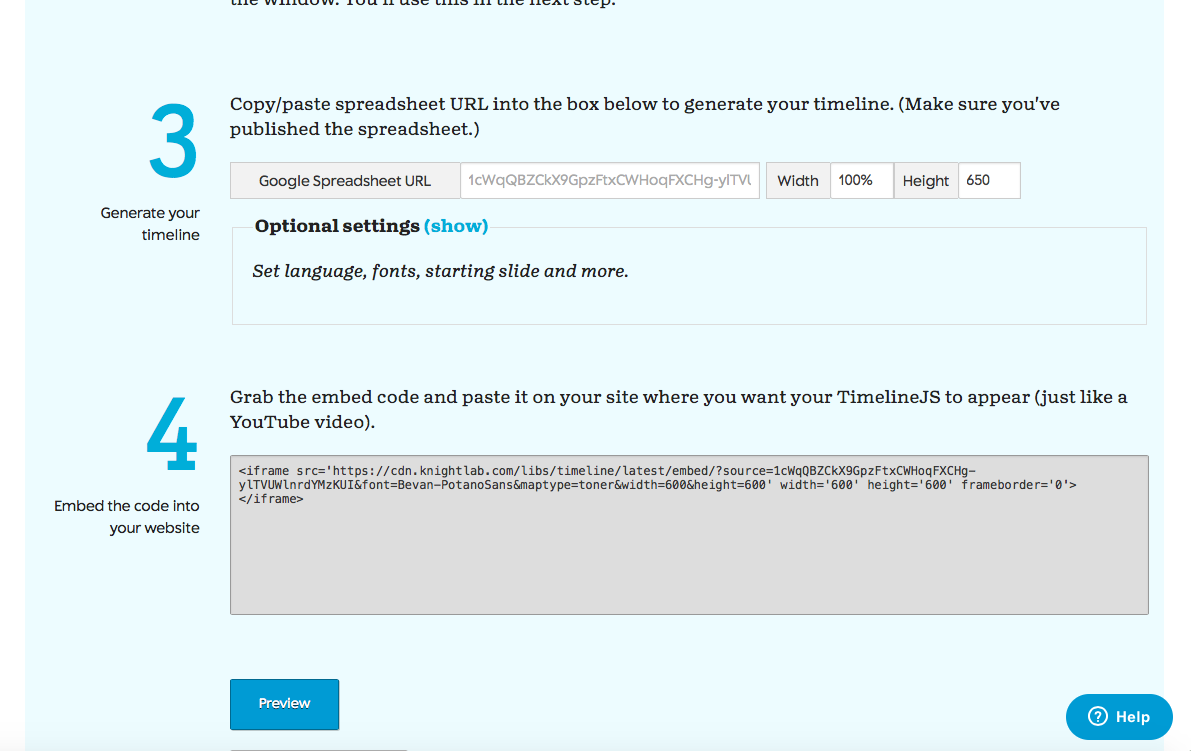
- Paste your copied link into the “Google spreadsheet URL” box (scroll down to the bottom of the front page)
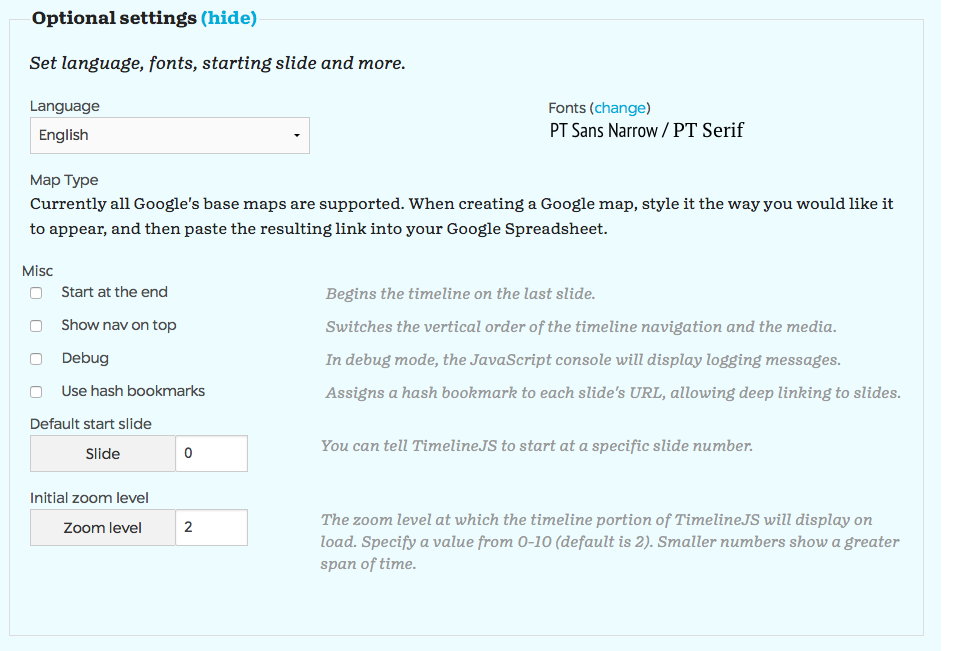
- Choose your styling options
Here, you can select features such as:
- Different fonts
- Start your timeline at the end
- Show navigation at the top
- Debug
- Use hash bookmarks
- Set a default start slide and zoom level
- Copy the embed code that is displayed and paste it on your website where you would like it to appear. Congratulations, you have made your own timeline!
If you run into issues, this may be because you need to download the Knight Lab Timeline plug-in to WordPress.
Other tutorials on TimelineJS can be found here and here
Nice work, that was really easy to follow, and it made a tool I previously thought was really complex pretty simple! Only recommendation I would make would be to add a little more about the CSS part–obviously this isn’t a tutorial about how to use CSS to format things, but for someone who was starting with a completely clean slate, knowing a little bit about what CSS was and if it’s optional or not could be good. But nice work!
Tonya,
I agree with Pallav that this was very well structured and really easy to follow. I especially liked how you broke down each section of the Google Sheets template file to explain what kinds of data the columns would accept and how it would translate to the finished timeline.
Overall, I think the styling and level of detail worked well, but there were a few spots where it seemed like you could have added more (like on CSS that Pallav mentioned) or intended to go back and add more but never did (like the Type column where there is a trailing “This includes…”). Also, I wanted to see the finished product and the link wasn’t explicitly to your timeline! The best option would have been to embed it in the post, but at least fix the broken link so your readers can get a sense of what their hard work will result in.
Great work overall.