In our continuing quest to explore what goes on “under the hood” of digital humanities projects, this week we are moving from the front-end client-side user experience to the database “back end” on the server side, where all the data storage and information retrieval magic happens. In order to perform analysis, or present the results of our research to the public on the web, we first need to collect, categorize and store our data in a way that will give us the best combination of structure and flexibility.
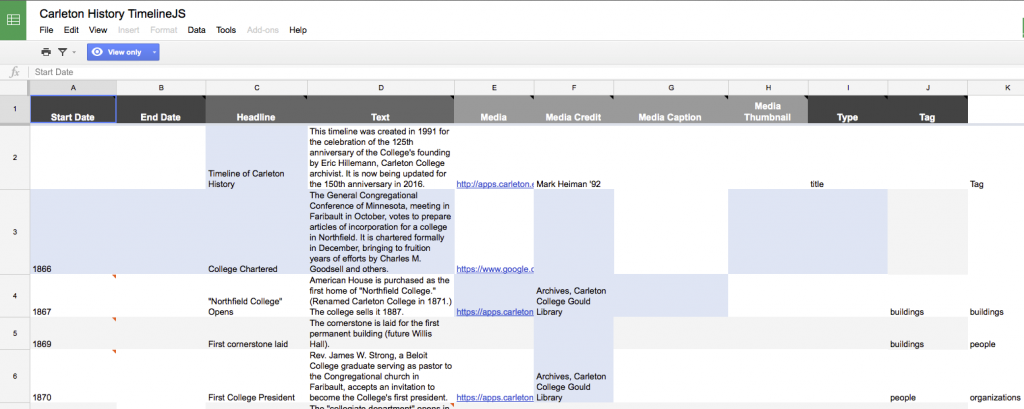
We’ve seen a few examples of how you can use a simple flat spreadsheet to store enough data to power some pretty impressive applications using JavaScript alone, like using the Google Maps API or the beautiful TimelineJS framework.
Last year, students in this class used TimelineJS to make a pretty slick Timeline of Carleton History, and the backend was nothing more than a simple Google Sheet.
This works great for the timeline, but what if we wanted to do different things with the same data? What if we wanted to reorder our data by something other than chronology, or extract all the people or buildings, or add spatial locations? And what if we wanted to model the relationships between those elements? Our spreadsheet is just not flexible enough for this. In order to store complex data sets, we need a more sophisticated way to store it; enter the relational database.
There is a vast amount of literature out there on database design theory and practice, but the articles we read for this week provide a good starting point into the general characteristics of relational databases, and the raging debates over how to move beyond them in the brave new world of ‘big data‘ in humanities research.
The key takeaway from these debates is that “data” are not value free and neutral pieces of information. Any time we break information down and classify it into categories, we are imposing our human world view and experiences on the information, whether consciously or not. This is unavoidable, but the best way to deal with it honestly is to acknowledge our biases, document our decisions and explain our thinking at each step of the process. The resulting metadata (data about the data) are critical for successful scholarly projects, and we will discuss their importance throughout the course.
In Class
 For today, we are interested primarily in exploring how relational databases work in a typical DH project, which often shares a lot of similarities with how web applications work in general. So we are going to stick with what we already know and get to know databases by exploring the backend of a WordPress site.
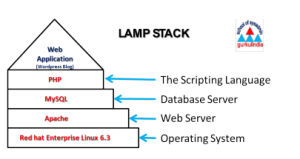
If you were going to do this the old fashioned way, you would need some space on a server running the LAMP stack (Linux, Apache, MySQL, and PHP) to install and run a fully customizable WordPress site, but we are going to using our cPanel in Reclaim Hosting which takes care of all the system administration work for us.
Most web applications and DH projects consist of two main components: files and a database. The main WordPress files you’ll interact with are the PHP files in the theme layer, which change the look and feel of your site, and the plugins in the plugins directory, which add functionality. Check out the Resources section below for more on how to customize these.
The database can be accessed via phpMyAdmin, a super helpful tool that lets you interrogate and take actions on the database without having to type SQL commands directly into a shell prompt.
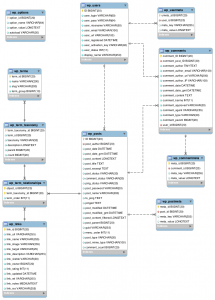
- Explore your WordPress db, consulting the diagram at right,
- See if you can figure out how the data and metadata of a typical post, page and comment are broken up and stored in the db.
- Add a new plugin and a new theme to your site.
- Did either change the database? Which one? Why?
Continue to explore the guts of WordPress and ask yourself: how are the data are structured, stored, and ultimately rendered in the browser? Do you understand all the component parts?
Assignment
This week we are going to dive into the archives and begin gathering data for our projects on the second 50 years of Carleton’s campus history. For this first pass, you are each going to choose a building that was built between 1916 and 1966 to research and eventually try to model in SketchUp. There are 18 of you and 23 buildings constructed in this period, so we may have to make some choices about what to include.
In class we discussed the college archives and collections and talked about the importance of metadata. Our excellent librarians have provided us with detailed guidance on how to translate the metadata found in the archives into the standard Dublin Core metadata schema employed by Omeka. Once we collect this data, we will import it and build a collection in an Omeka site, but we’ll start (as many good DH projects do) gathering data on the simple spreadsheet that you should have access to in Google Drive.
Have a look at the Carleton Campus Buildings 1916-66 list and think about which building you might want to model
- Think about your comfort level and desire to dive into SketchUp, and adjust your choice accordingly: if you’re totally gung ho, pick a complex building, but if not, go for something simpler.
- Once you’ve seen a few pictures and have an idea of what you want, put your name in the Modeler column to claim your building
Once you have chosen a building:
- Search all the different archival databases to find as many images of your physical building as you can find
- The librarians have set up a course guide for us that should be your starting point for entry into the archival holdings.
- Create a new folder for your building in the BuildingData folder of our shared Google folder.
- Download each image file you find and move it into this folder
- Then document all the metadata, following the instructions in this Metadata Guidelines for Dublin Core document
- Add records for each image to the Data Entry Spreadsheet
Blog
For this week’s blog assignment, write a process post detailing your experience getting to know the archives, gathering data, and being careful about metadata. Is this how you have conducted research before? What are the pros and cons of collecting data this way?
Resources

