The Links tool on Voyant Tools is a neat and interesting way of using a text analysis tool and a network analysis tool at the same time. It allows you to use a network analysis graph for words other than what we have done in class with using people or places as our links. This tool allows the user to see what words are used most in either a corpus or in a string of documents/articles. When one of the larger words is connected with a bunch of smaller words it means that those words came most often after that large word. So, this tool can show both how often a word showed up and what words came most after that word. If one were to be interested in a certain writer of books or a writer of articles in any major online news station and that person wanted to know what words that person uses most or wanted to know what phrases that person says a lot because with this tool that said person can figure that out. Also, If someone was wanting to see if a reporter was targeting a certain person or organization, they can use this tool and see if the most common words showed if that reporter repeatedly said that person/organizations name. Now here is how to use this awesome tool.
Tutorial:
Step 1: First you will want to type this URL into your browser :
![]()
It will take you to a page that looks exactly like the Voyant tools we have used before:
Step 2: You will now need to copy whatever you want either a full text corpus or in this case news articles and paste it into the add texts box:

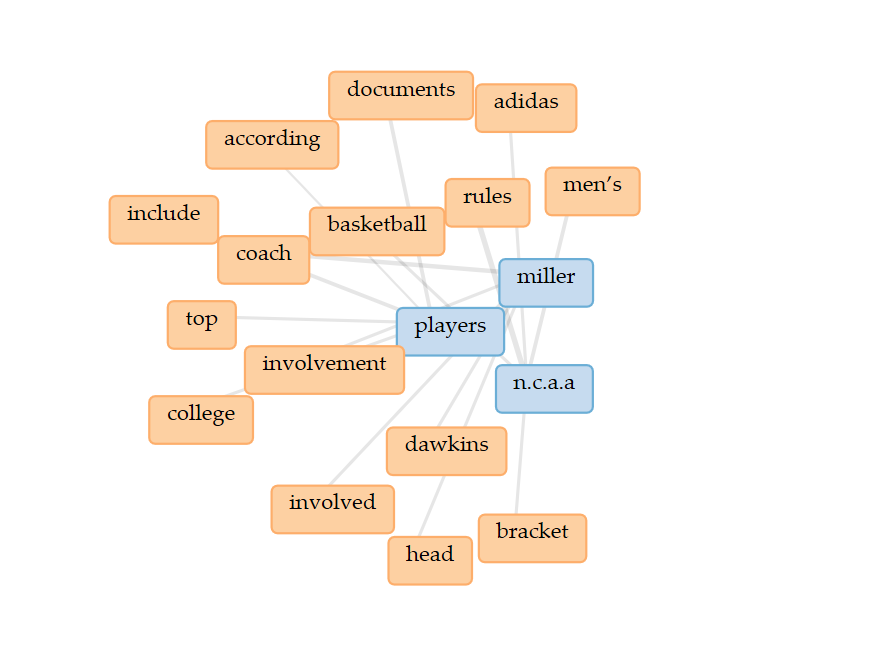
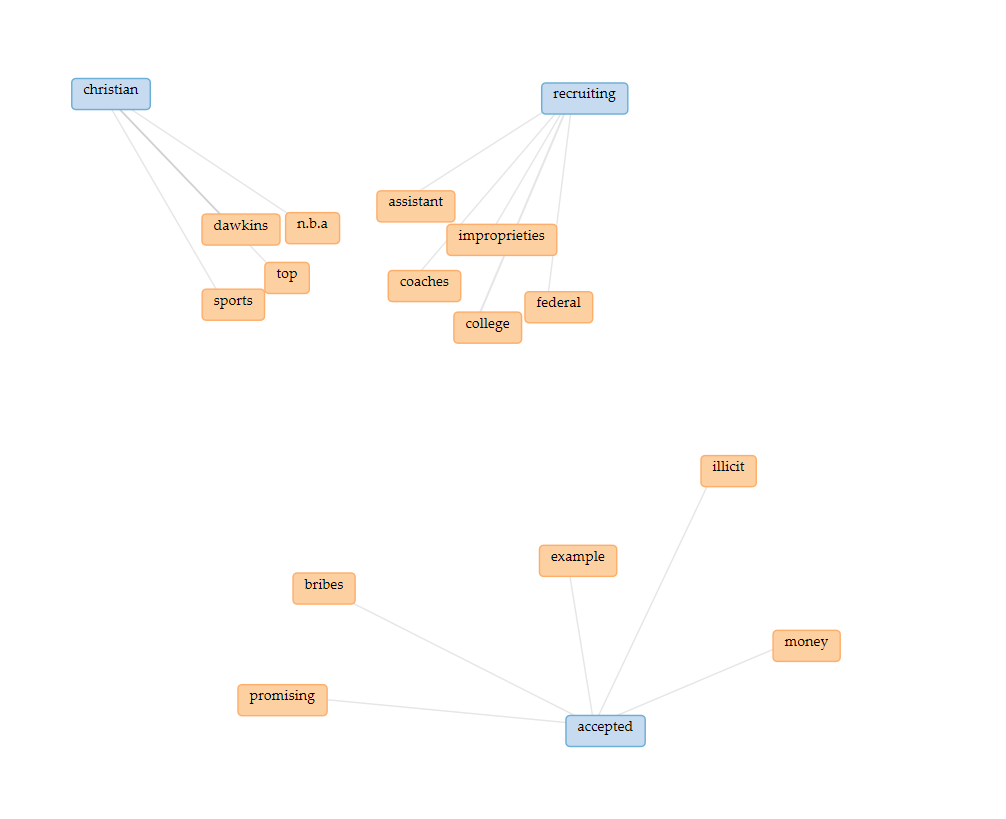
Step 3: Once you hit Reveal you will be shown the graph of all the most common words in the form of a network analysis graph:
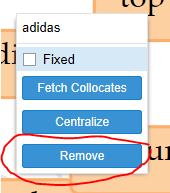
Step 4: By clicking on a certain word if it is too messy for you or you want to make it look neater you can just click on the word and an option will show up for you to remove the word:
Step 5: You can also centralize any word and see what other words are used either before or after that centralized word or whatever words are used in a similar context as that word:
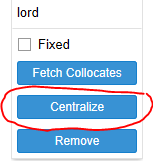
Then you will get something like this once you click on centralize:

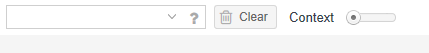
Step 6: If you want to increase or decrease the amount of blue colored words then you go to the left corner of the tool and slide the context button up or down and then you can also hit the clear button to reset it to the context that you want if the tool acts up and doesn’t do what you want:
You can also move the words around freely and make the graph a little neater:
Good Job! You have successfully created a network analysis graph on a text analysis tool.
Here is a link to more tools that are on Voyant Tools that I used to find more about and learn about the many tools Voyant Tools has to offer.
I didn’t realize that you could move the cores of your context map around. That seems like it would be a useful tool, as in my experience with Voyant Tools the context maps ended up feeling a little busy. I like the idea of creating context clusters to illustrate contextualized groups of terms or words.