I love that, in this class, we start off with exploration and discovery and rediscovery. With that in mind, I’m going to showcase my childhood house and explain the digital humanities project I looked into. – Emanuel Linton
Nostalgia Trip
I’m going to begin with my childhood home where I grew up from birth to the age of 5, unfortunately.
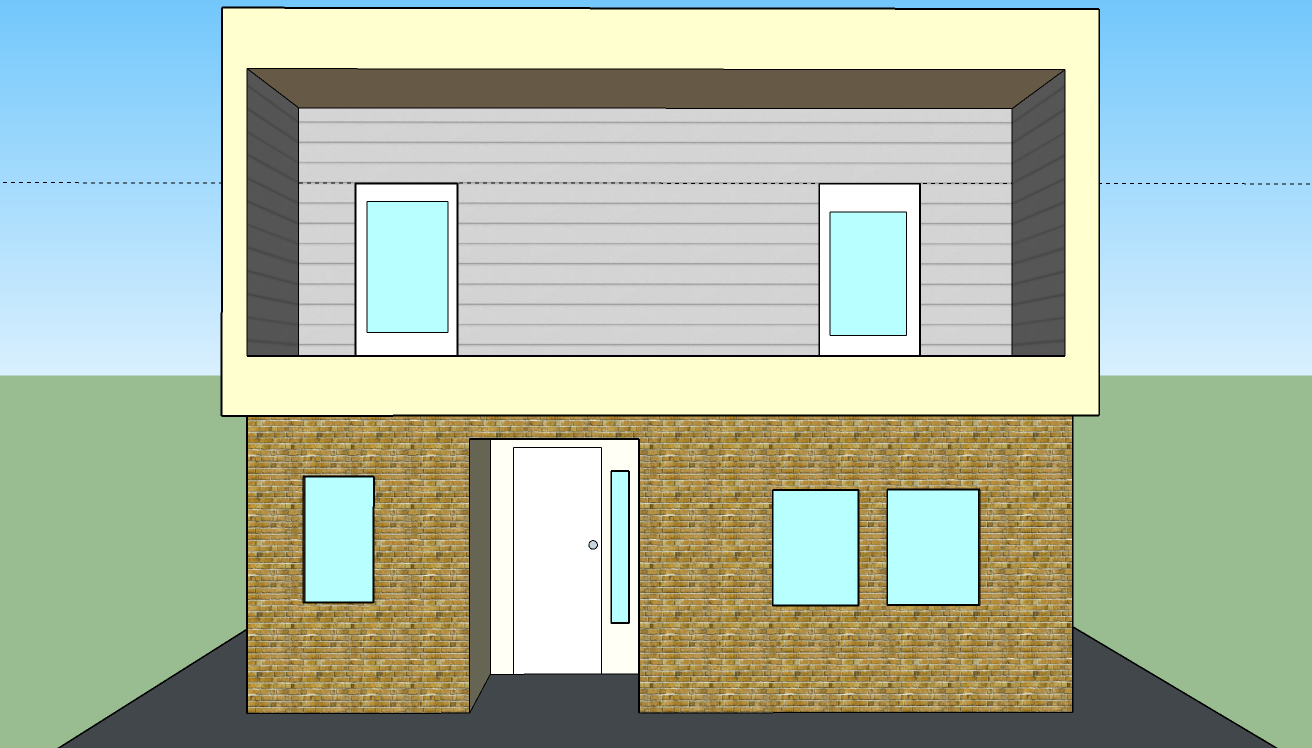
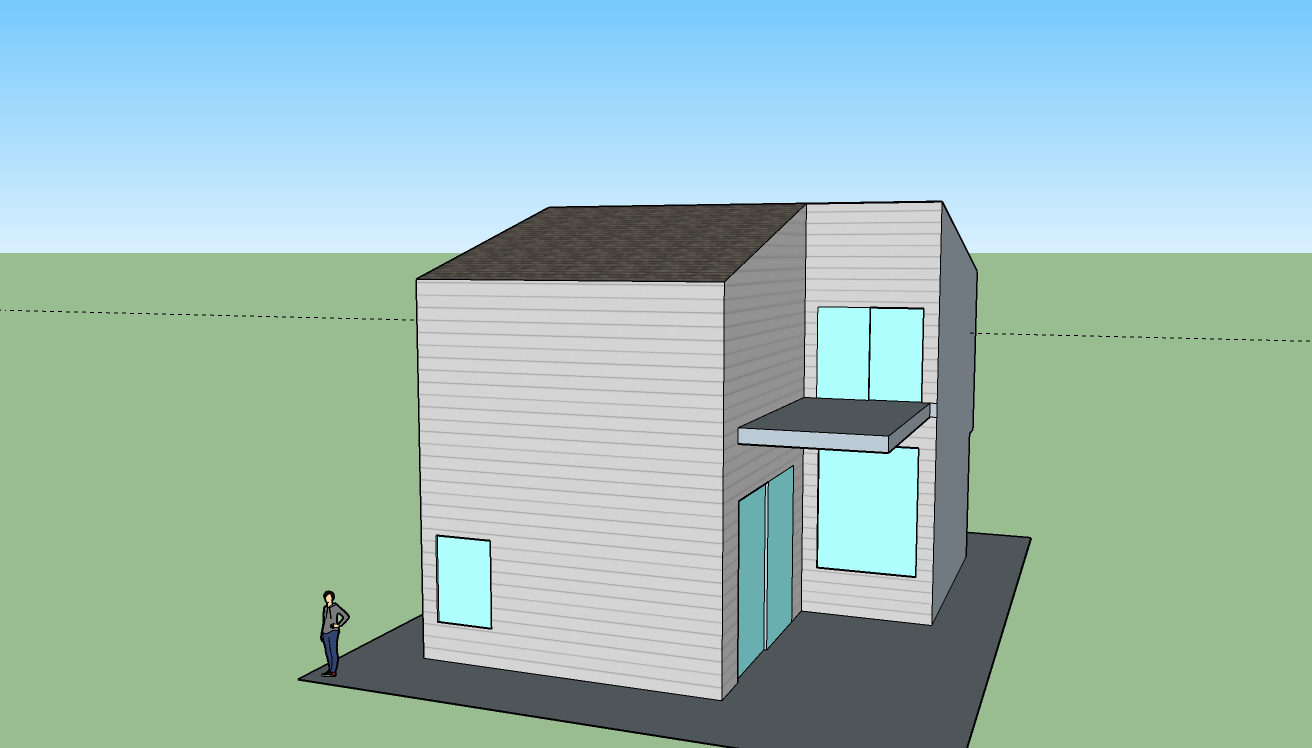
Even now, memories about my childhood home flood into my mind. Some memories actually include pieces of my house I’d actually forgot to add! One major piece includes the upstairs patio, where I’d forgotten a window adjacent to the window. If you’re asking why the sides of the house have no details, the answer is that since this is a townhouse there technically are no sides, but only a front and back.
Besides details here and there, I omitted the front doors gate since I couldn’t find good enough gate assets, although I did decide to also look online for additional assets for gates. The balcony’s guard rail and the patio’s guard rail were also omitted as I couldn’t find them. The windows unfortunately look solid because they are, but exploration is fun, so I found window materials after I exported these graphics.
On Vogue and Reading Robots
Before I begin describing the sources used and the process involved with Robots Reading Vogue, I just want to say how much I appreciate the front page. It doesn’t waste its time with boring introduction paragraphs and lets you dig right into the data with the different categories! So awesome!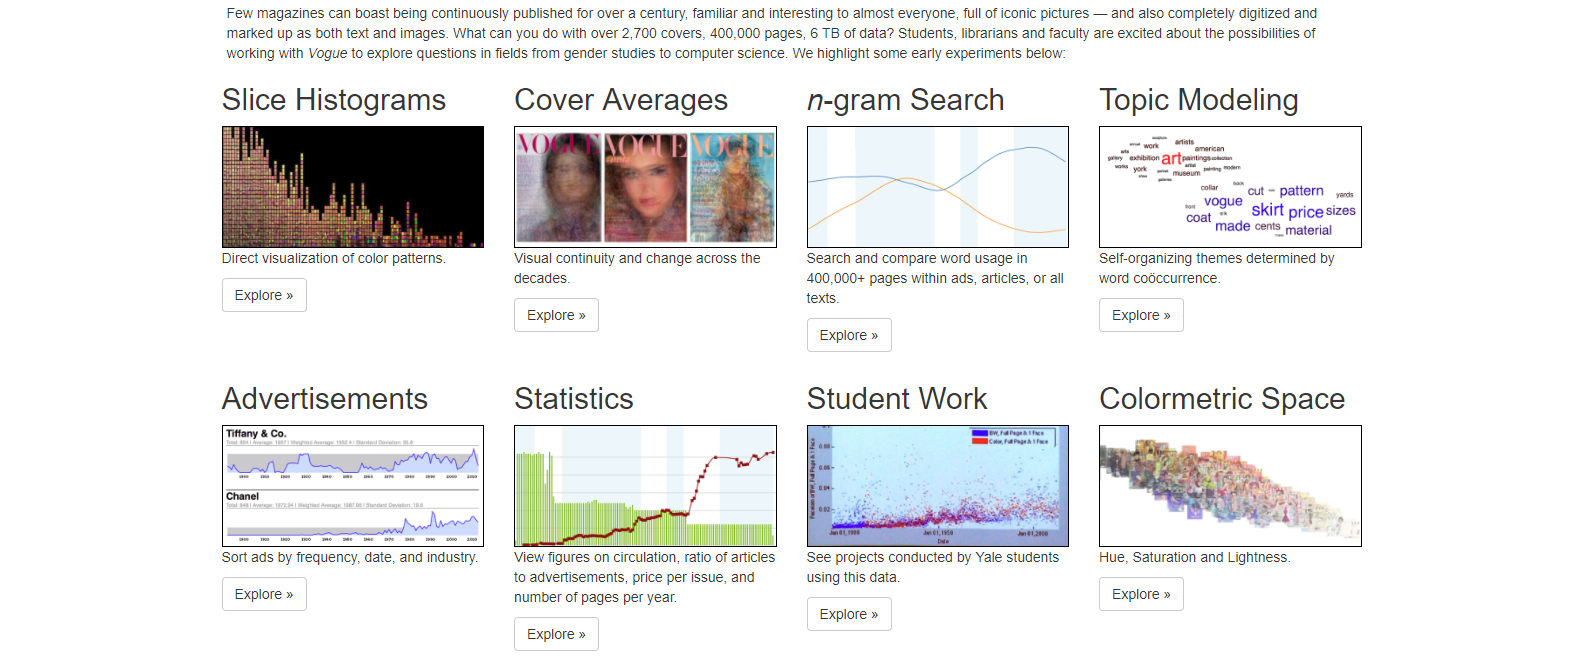
Anyways, the sources are the one and only Vogue Magazine catalogs, spanning about 110 years. Simple enough, except when it comes to specific data wanted by the Yale team behind this endeavor. In fact, I’m going to uncover the details of 3 of these sub-projects.
Slice Histograms
The sub-source for this category is sliced covers from Vogue publications, from 1901 to 2011. The reason for their slicing is to make it easier to find the dominant color of the slice than it would be for an entire cover. I think this is a great call, because this methodology gives us a much better understanding of the color usage on these covers. The Python language provides the histogram setup, giving us the viewing pleasure.
Colormetric Space
Once again, covers. This time, the entire cover is used since the team behind this project wanted to find insight on the patterns Vogue developed over the years. This presentation uses ImagePlot to find the colorful nature of covers from the 1910s to the 2010s (up to 2011). This involves an extremely large image file; not only is this image large, it’s also uncompressed which uses a ton of memory, but I’d say it’s worth it.
Diana Vreeland Memo Generator
Diana Vreeland was a Vogue editor-in-chief from 1963 to 1971 after her time working in Harper’s Bazaar. Her memos among the Vogue staff were quite memorable, to the point where Memos: The Vogue Years, 1962-1971 was written to collect these memos for all to see. The team behind Robots Reading Vogue decided to make a few memos of their own. Markov chains are used to predict sentences Vreeland would write and even the subjects she’d write about; the Markov chains were likely programmed with Python, but the team does not reveal how theirs are created. While I think this is pretty cool, at the same time, the program needs much more work because I’ve read a couple of Vreeland’s memos and the auto generated version is off by many sentences, but the subject matters seem okay.
Those are just three examples of the categories the team have created to quantify Vogue Magazine’s history.
I hope you liked what you read.