I found an easy and intuitive program called myHistro that creates projects combining the use of timelines and mapping to display data. The data is presented video that connects the timeline data with changes in location viewed on the map. This program is especially useful when telling a chronological story about the data. Projects made using this program are helpful in providing a better sense of the relationship between the times and location of the story being told. The program would be useful in visualizing historical events, migrations of peoples, or movement of other specific goods, ideas, etc. that span many years and travel among many different locations.
To provide a rough example of the process of creating a myHistro project, I mapped out the history of my immediate family beginning with the locations and dates of my parents’ births. The video aspect of the timeline map allows me to better understand my parents’ educational journeys and the various places they’ve lived before they began their careers and the part of life of raising a family. I will list my steps in creating this timeline map below.
- You must create an account before creating any project – this process is free and rather brief.
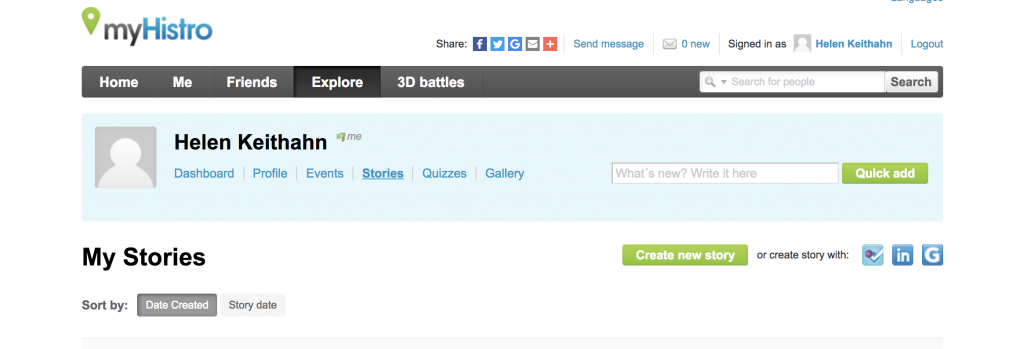
- Once you’ve created an account and logged in, you will be able to view your dashboard. Click on the “Stories” section of your account then click on the green box that says “Create New Story”
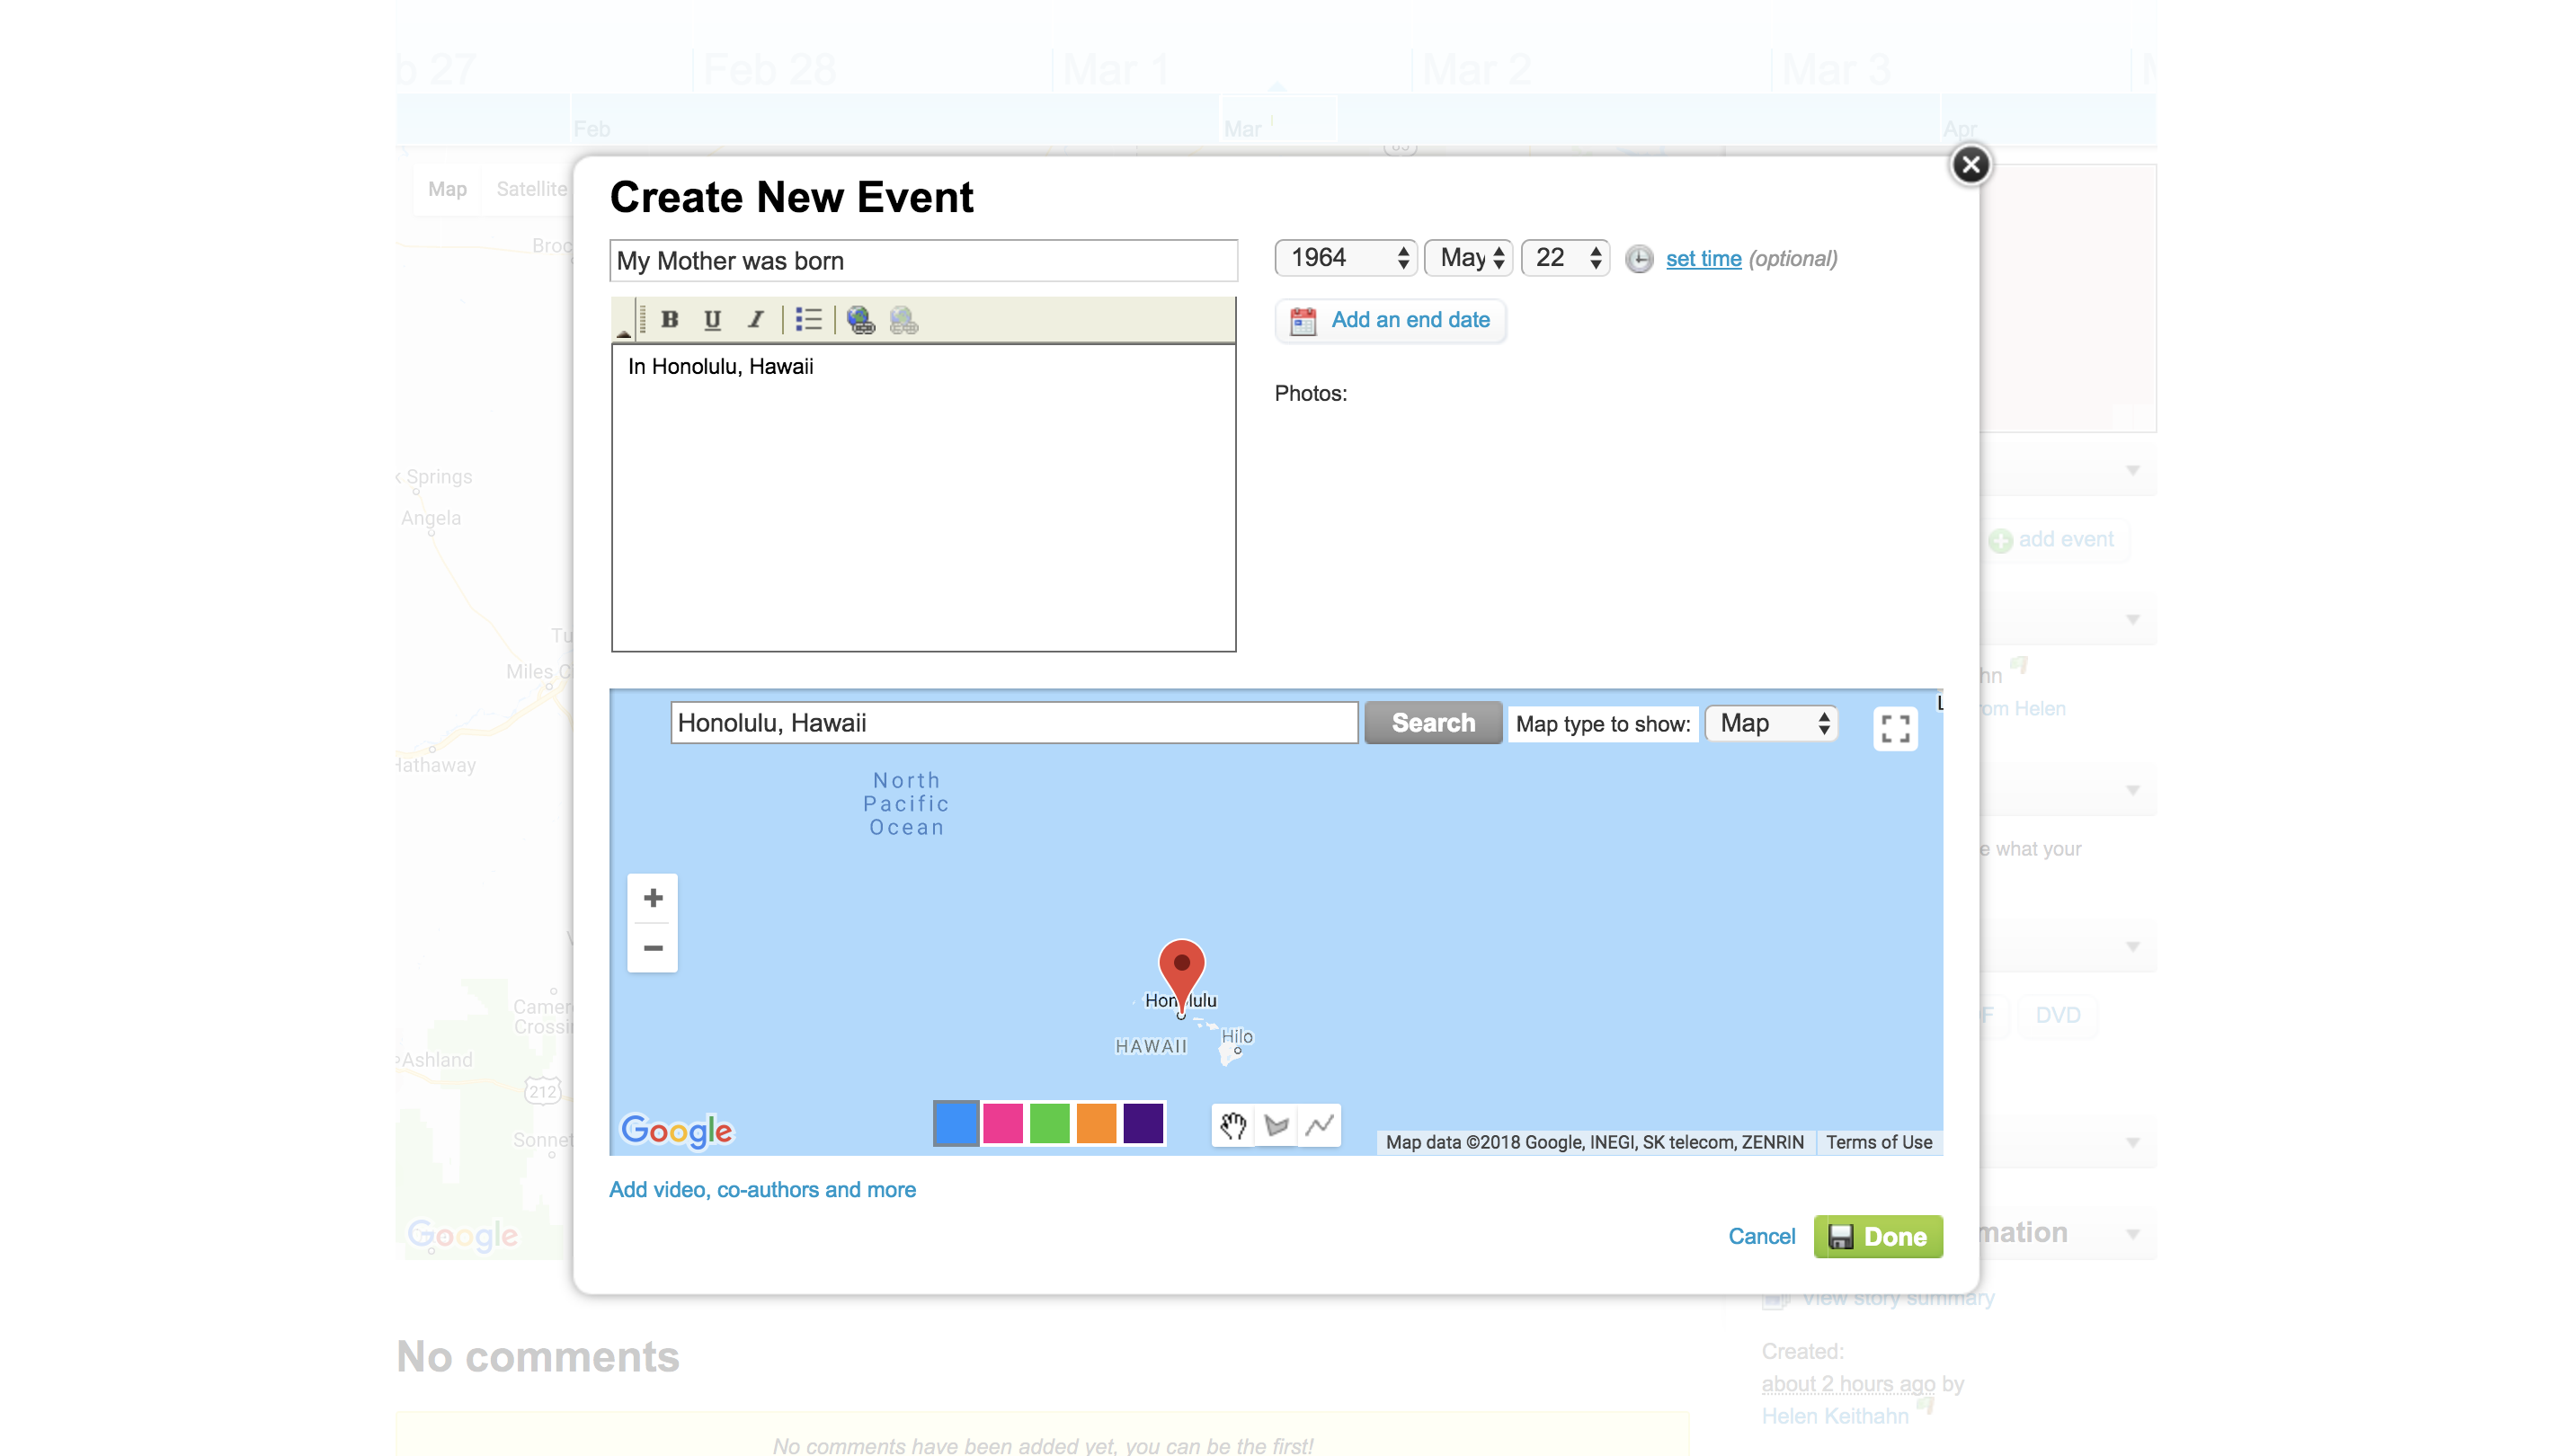
- To begin your story, create a new event. In the edit box, you are able to title and caption the event and specify the date and location on Google Maps.

- Continue to add events. Each new location will be tagged on the map. The event, lasting for one day or for multiple years, will be shown on the timeline. As you can see, there is an option to add an image for each event.

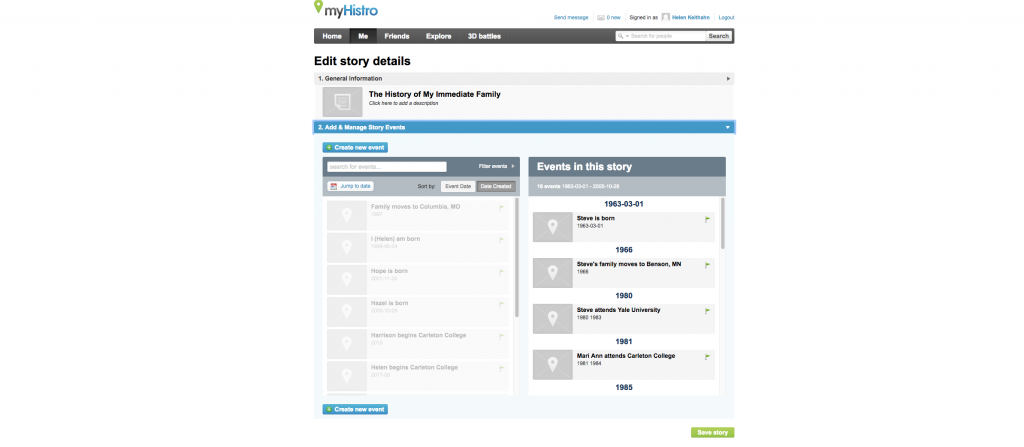
- If you would like to go back and change information about a specific event, click on the “edit” option and access each individual event in the dropdown section, “Add and Manage Story Events.”
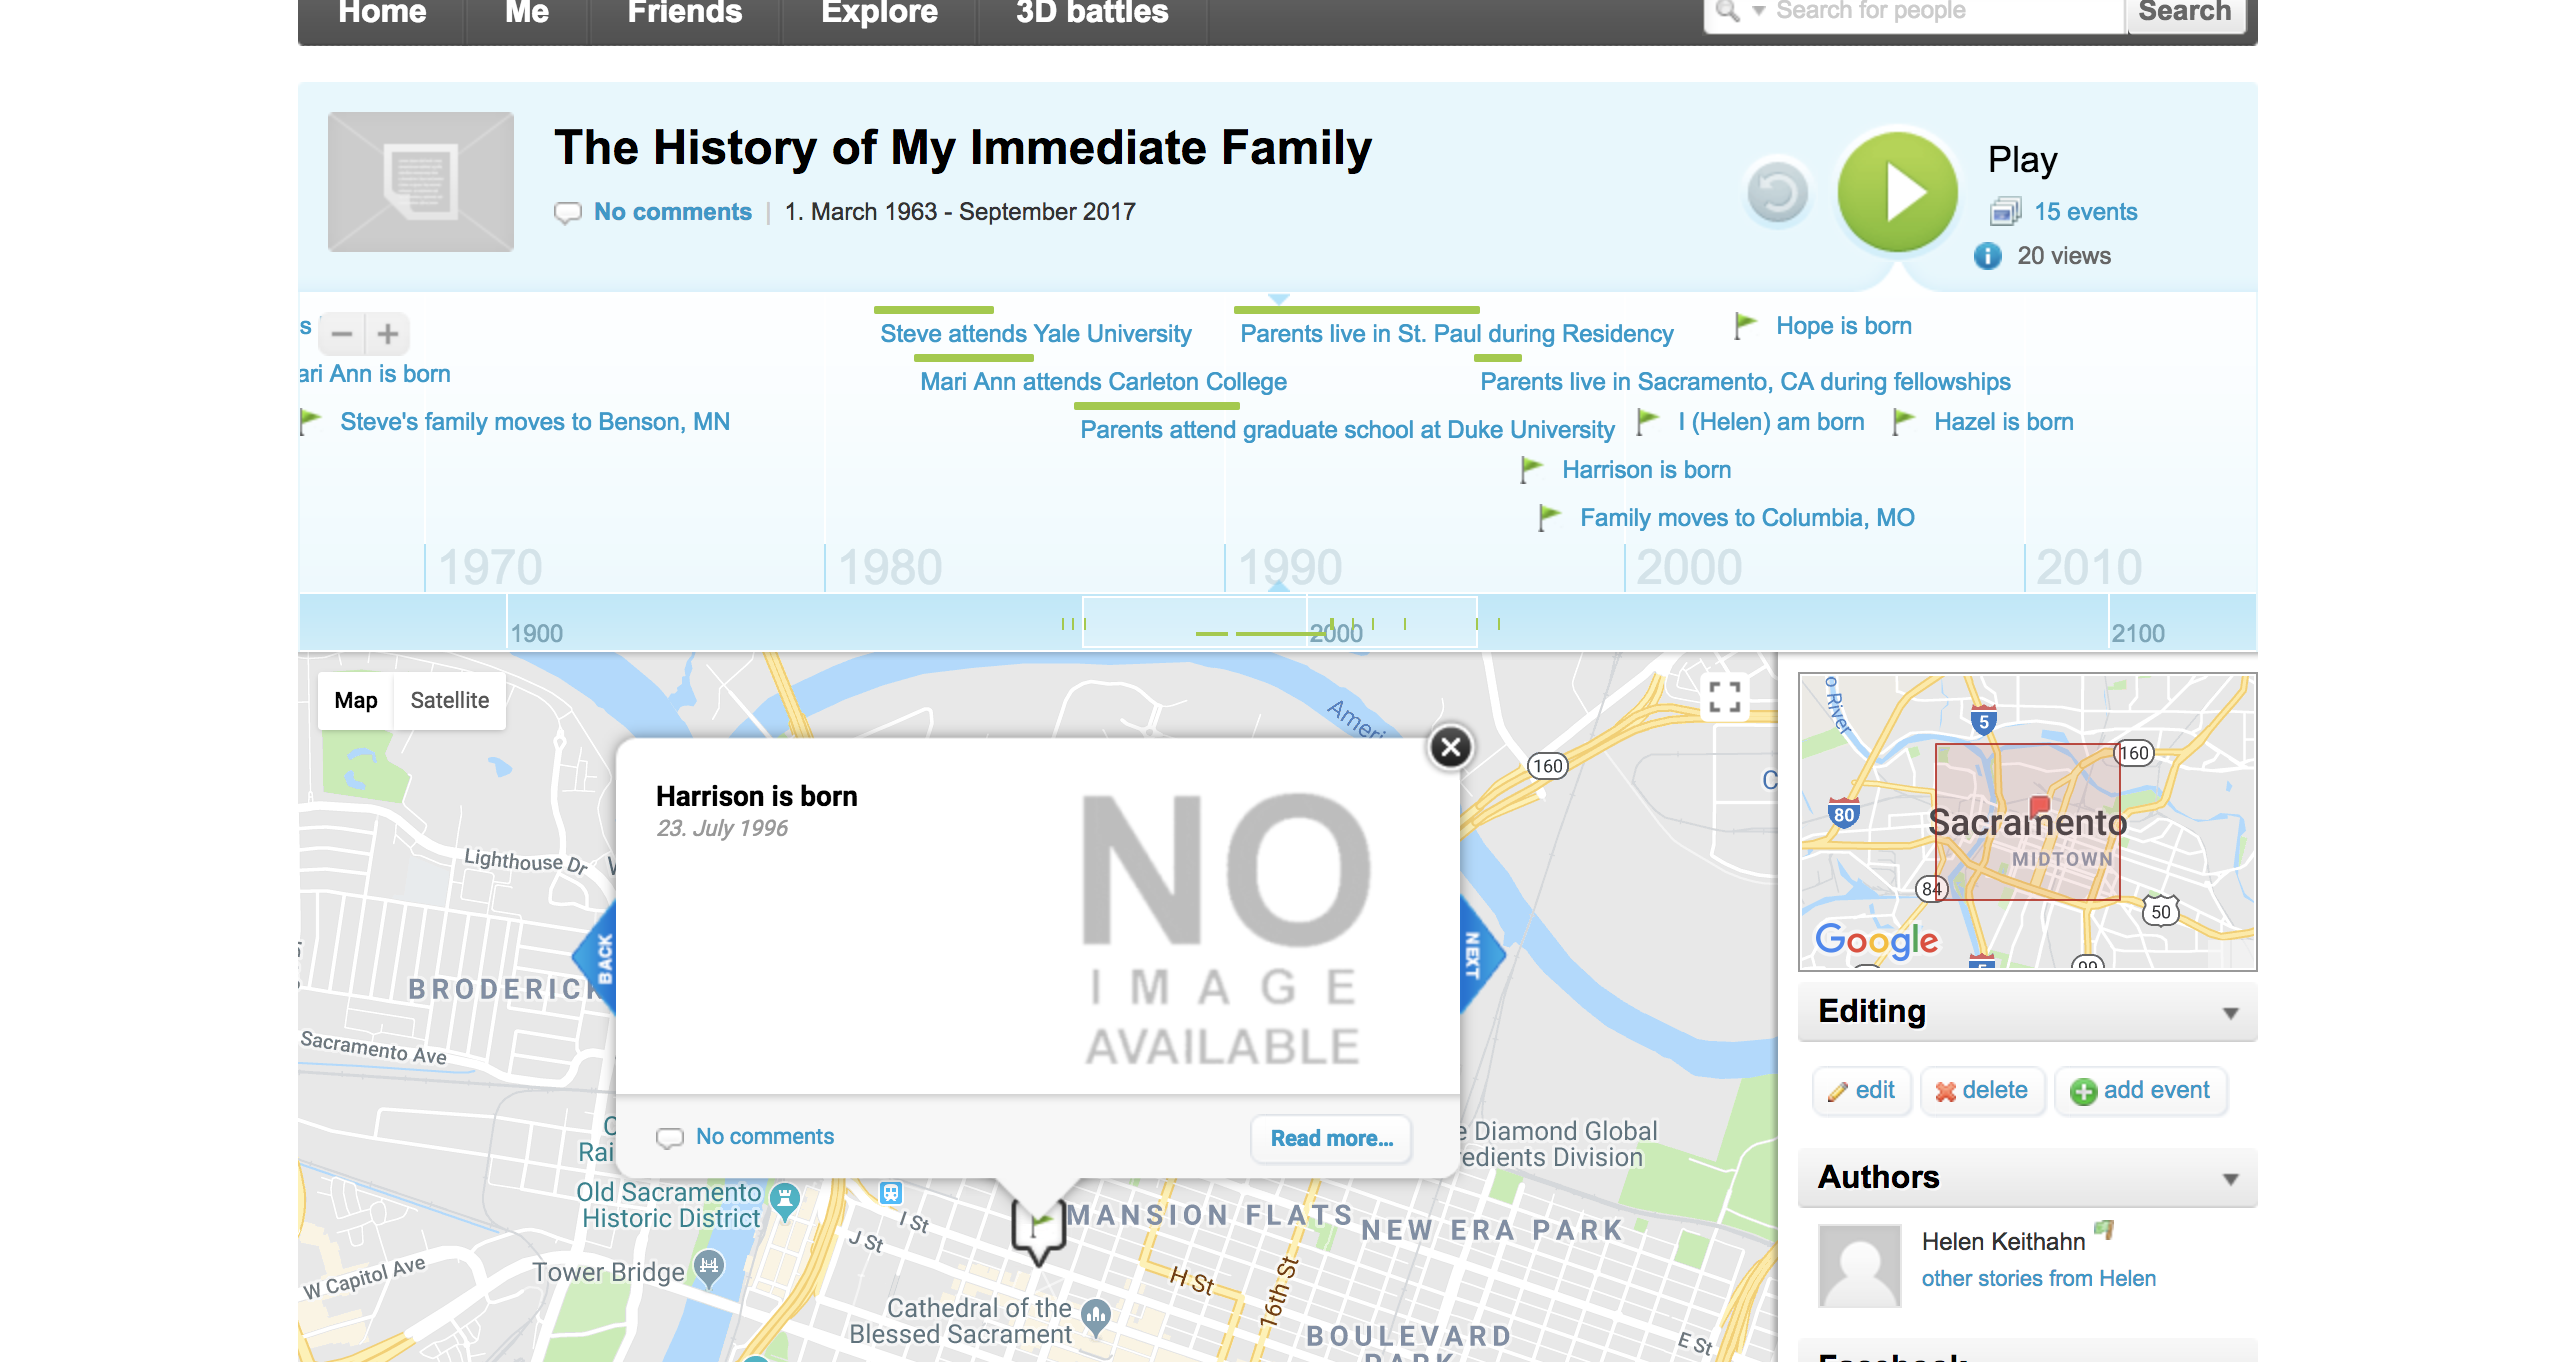
- When finished adding and editing events, press the large green “Play” button to view the video of your timeline map. Click here to view my family project. My project is simply a rough idea of the creation process. You can view more complex educational projects made by others under the explore tab. One specific example is a project about Japan’s Early History.


Looks like a really cool timeline/mapping tool! The tutorial is pretty intuitive overall, and I also looked over your project. I am just wondering if you can change the duration for each slide (event) when you click play, since it would make sense to spend less time on one slide than how it is now.
I really like your tutorial, it was easy to follow and got straight to the point. I also think that your example nicely represents how this tool can be used. I’m wondering how this could be applied to other DH projects, and if it restricted to modern events due to the mapping aspect. Can you represent any sort of historical project? If this limitation does exist how could they format their site to accommodate historical timelines?
This is an awesome timeline tool! It seems a little easier to use, especially when adding pictures, than Timeline JS. The slides loaded very slowly though, so I’m wondering if myHistro is less powerful than other timeline tools. It does seem more user friendly!
I fully agree myHistro ‘was’ the best free webtool available. It is a great loss that it is no longer available. Do you know of any other with the same functionalities : geomapping pictures videos, embedding in a website, and very important : pdf export !