
Last time we used OpenRefine to clean up a dataset of book images from the British Library. In particular, we were cleaning the “Date of Publication” field so that we could use it in a timeline. Today, we are going to export that cleaned data and create an interactive timeline visualization with it.
One of the longest-running types of applications is an interactive timeline. We will do a class project to convert our flat spreadsheet into an interactive timeline using an easy to use application, but there are other tools that require more coding and show you how these work. Take a look at the SIMILE timeline tool for an example of one of those.
Export from OpenRefine
First, we’ll reload the project file we were working with last time.
- Download the data in the cleaned project file from google drive here
- Launch OpenRefine on your machine (if you need to redownload the program, follow the installation instructions from the last lab)
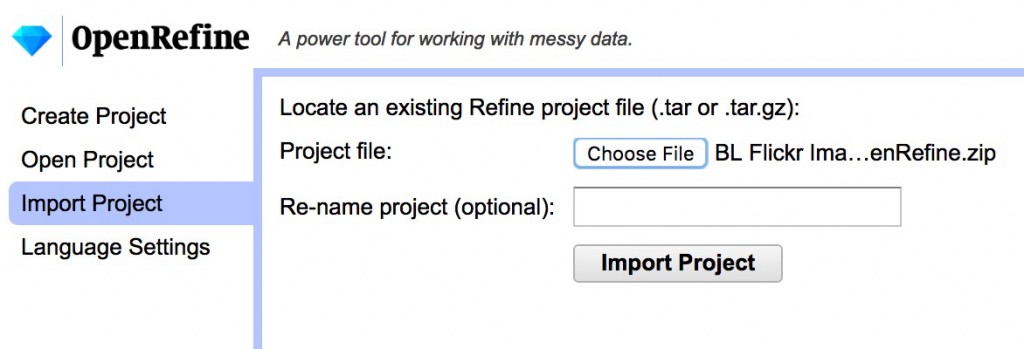
- On the main page, Import Project, choose the downloaded zip file and click Import Project
We are going to make a timeline of the books published before 1700.
- Use the number facet on the Date of Publication column to select a range.
- We will split up the 131 records pre-1700 into 13 groups of 10 each and each export a range as a csv.
Matching Data to Framework
One of the biggest challenges of using off the shelf platforms is figuring out how to map your own data onto the framework the app developers have set up. We will collectively figure out which data we will put where in the TimelineJS template.
- Go to the TimelineJS page and follow the 4 step instructions to Make a New Timeline
- In Step 2, one person should download the Google template and share it with the rest of us by putting it in our common folder so that all may edit.
- In Step 4, copy the embed code and paste it into a new jsBin. This is where you will work on your own date ranges for now, and we will combine them all together next week.
- Once you are setup, delete the template data and move over your personal date range from the BL Flickr images data set. The dates and captions should come over with an easy copy/paste, but then you’ll probably need to finesse the rest of the data a bit.
- You might need to change the number format of the Date columns to a different date display or even Number > Plain Text to get them to display and order properly
- All entries should have a brief headline that summarizes the text on that date’s card, which you’ll need to write
- Where there are images on linked, you might need to finesse the site to get them to work.
- Where there are no images, see if you can insert a Google Map if appropriate.
- NB: All Media should have a Media Credit, which will usually be “British Library“
- Finally, explore what happens to the timeline when you use tags to categorize events.
If you’re in doubt or stuck, post a comment, ask a question on your blog or (as a last resort) send an email and we’ll try to help each other out.
