
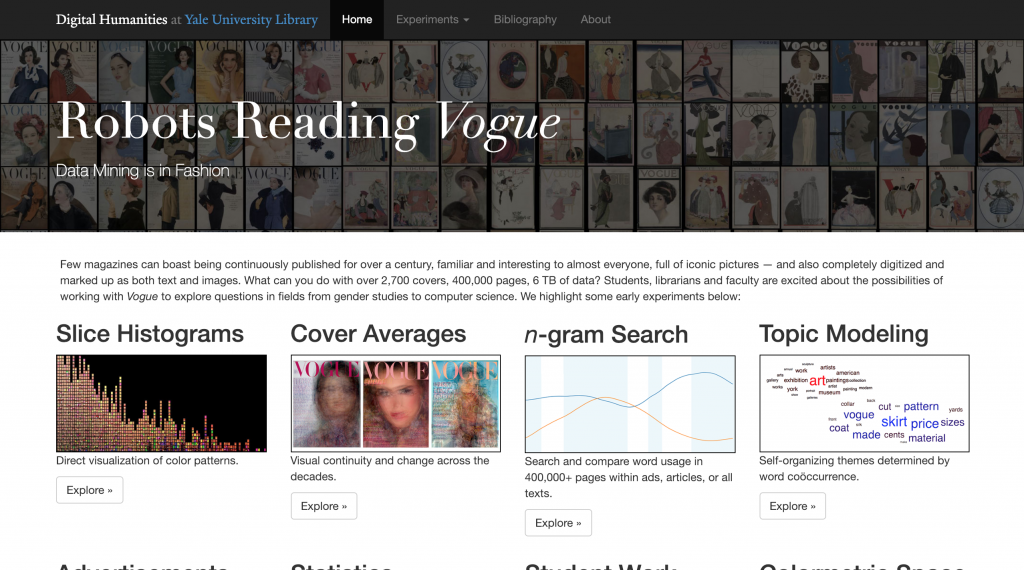
Vogue has arguably remained the most iconic fashion magazines for over one hundred years. Seasonal styles have come and gone, but researchers at Yale are on the hunt for trends that might not be so obvious to human readers.
In 2014, art librarians, digital humanists, and computer scientists alike collaborated to explore the massive catalog of the Vogue archives and how the magazine had changed over many decades. Researchers ran several experiments to compile comprehensive graphs, images, and diagrams on everything from advertisements to the color composition of different issues. The website for the project lets you access a lot of these tools to browse or explore for yourself.
Sources
Luckily, most of the hard work of gathering data had already been done by the archivists at Vogue . The archive contains a complete collection of colored scans dating all the way back to 1892. This meant most of the image data was ready to go, but text would have to be pulled from the pages and processed.
Process
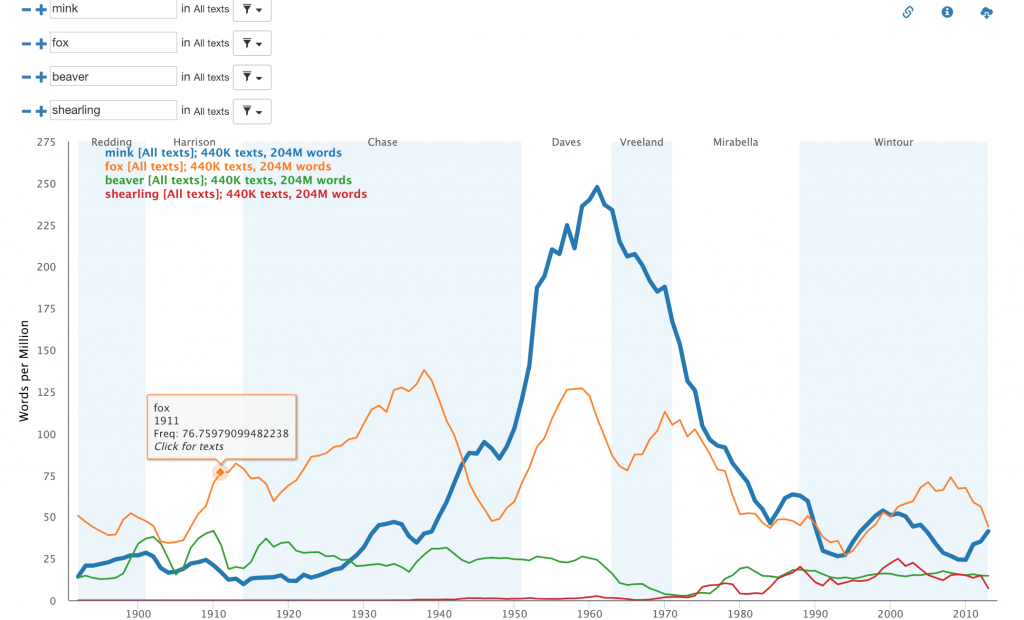
From the magazine scans, researchers use OCR software to read text from images to use in experiments like n-gram search. The N-gram search feature on the project’s website allows you to enter multiple words or phrases and searches for their respective frequencies in the raw text returned by the OCR. I would imagine the text has metadata which relates the word or phrase to a specific issue and date of the magazine. From there, they implemented an N-Gram search tool called “Bookworm”, an open source version of Gooogle’s original N-gram search tool. To top it off, the data is displayed in a smooth, interactive graph via javascript library Highcharts.
Images had to be processed a little differently. In the site’s “Colormetric Space” experiment, project collaborators used a free tool called ImagePlot to create a graph of Vogue’s most colorful covers across the entire catalog. Images are categorized by average color, HSL values, and RGB values to maximize the utility of the images in data analysis.
Presentation
There isn’t anything too crazy about the site’s UI right off the bat. Its skeleton has a normal bootstrap design with a traditional navbar. Still, there’s a lot of fun to be had with the interactive graphs and search tools that collaborators have developed. Many of the graphs have a nice interactive scalability feature so you can zoom and drag to look at individual data points.
The project’s multi-media design is one of its other strong suits. Static Images and videos give you a better idea of the trends and conclusions drawn from the experiments. They also provide a nice grid design that makes the information a little more digestible.
Takeaways
All in all, Yale’s digital humanities project “Robots Reading Vogue” is a great combination of research and interests across a wide range of disciplines including fashion, computer science, and consumer studies just to name a few. You don’t have to be a fashion-lover to play around and learn a thing or two about the data behind one of the world’s most acclaimed fashion magazines.

HeyWell put post.
Awesome