
What is Map A List and how is it helpful?
Map A List is a program that works with GoogleMaps to plot location points from a spreadsheet. It is a great way to turn a list of locations into geocoded points without having to plot each one. The points can be plotted in different ways in order to interpret data differently including clusters, heat maps, and plain location points. It is a useful tool when analyzing sets of places in relation to each other. It is also a piece of free software done with in a web browser, providing access to those with a budget.
1. Getting Started
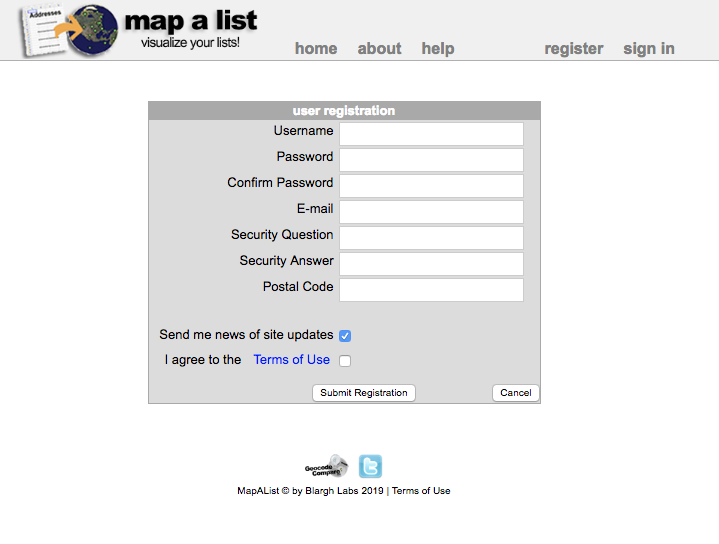
First you need to have a set of locations within a spreadsheet. Either compile your own data in a Google spreadsheet or open a spreed sheet file in GoogleSheets. For this tutorial here is the data set I used. Go to Map A List’s website and register for an account.
2. Importing Data
The next step is importing the GoogleSheet into the program. To do so, follow the steps in Step 1:Choosing a Map Source by importing the spreadsheet of your choice under “Select Spreadsheet” and ensure the worksheet has all your data on it.

3. Assign Fields
After the Spreadsheet is uploaded to the program, it asks to confirm the columns are correct. There are a variety of ways to provide location including street addresses, cities, states, countries, zip codes, and latitude and longitude. For the example data provided make sure Address 1 is looking at the column titled address, the City is looking at the column city, the State option is looking at the column region, and the Country is looking at the column country. After checking those fields hit the button at the bottom that says “Apply.”

4. Configure the Map
Next the program will geocode the points, which may require prompting the program to finish all the points depending on the size of the data. After, the program will give the option to pin the points in different ways depending on the desired way to present the data. Choose from the dropdown options and preview the map as many times as desired. Once you are satisfied with the appearance, move on to the final steps of finishing and publishing the map.null

5. Finishing and Publishing
The last step is to set the center of the map and the default opening zoom. If left unchanged the map will open to a full world view. For the data in this tutorial a good “zoom” is 12. To see what the settings look like, hit the blue button “Save & View Map.” This is also how you publish but you can hit save and view as many times as needed until you are satisfied with the maps’ appearance. There are multiple options to shared the map, located under the preview version of the map including: email, Twitter, Facebook, and more.

Resources
- Map A List’s Help Page: https://mapalist.com/Public/Help.aspx
- Another Tutorial: http://www.kwantu.net/blog/2016/12/28/how-to-visualise-your-data-on-a-map-using-mapalist
- Yet Another Tutorial: https://www.makeuseof.com/tag/mapalist-map-address-list-google-map/

Emily this tutorial a great. This is the first free open source geo map with simple steps. I wonder if the tool can do more. I tired to impact GDP by state and there was not a lot of analysis from the tool.