
So you have a bunch of data, but you’re not sure what it all means. One approach would be to import the dataset into Excel and create a simple graph or chart. Alternatively, those with programming experience might use tools like D3.js or the R graph gallery for a deeper look into the data. But it’s annoying to compromise between a friendly UI and powerful data analysis. Thankfully, Tableau makes it easy to upload your data and start creating an impressive data visualization. With Tableau, you can provide valuable insights into the spatial and corollary relationships hiding behind your raw data. T
Downloading
In this tutorial, I’ll be using a free trial of Tableau Desktop which you can download here.
Getting Started
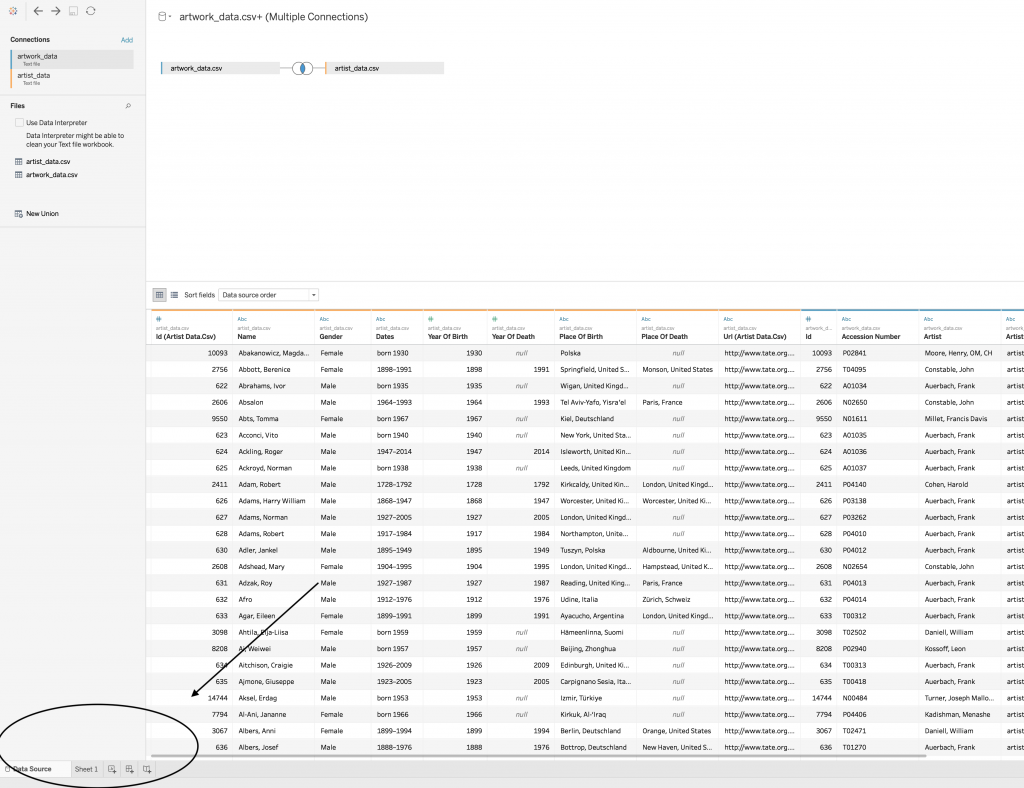
When you open Tableau, you’ll find a list of supported data formats in the left-hand sidebar including Excel spreadsheets, JSON files, and spatial files to name a few. If you’re searching for a dataset, there are a lot of great repositories full of interesting data. Data.gov and Github are good places to start. Once you have your data, click your desired file format on the sidebar and navigate to your dataset, or just drop it into Tableau’s window. I’ll be using data from the Tate Gallery Collection.
After you import your data, Tableau will forward you to its Data Source Tab. Here you can see a spreadsheet of your data along with a few tools for cleaning up or merging your datasets. To start analyzing your data, open a sheet tab in the bottom left of the window.
Navigating in Tableau
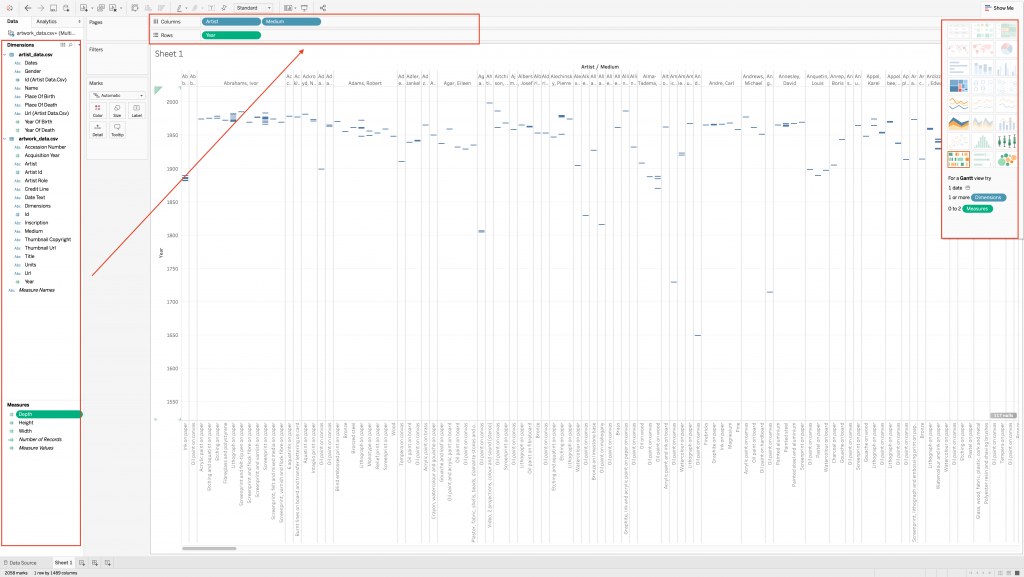
Once you’re in your sheet, you’ll see the different fields in your dataset listed on the left side of the window. Tableau automatically categorizes your data into two categories: dimensions and measures. Helpful tip: you can convert a dimension to a measure or vice versa by right-clicking on component>convert to measure. To add these components to the sheet, simply drag them to the row and column spaces at the top of the page.
Adding visualization
Tableau will automatically suggest a variety of different relational visualizations in their “Show Me” tab. By selecting different data fields, you can see which visualizations are available in the top left corner of the window.
Cleaning/Filtering the Data
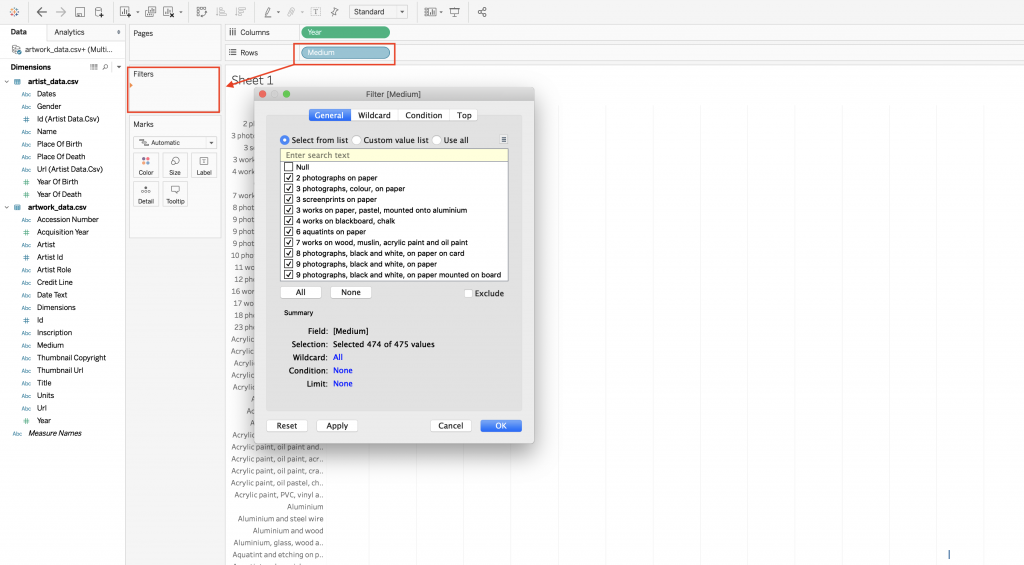
You might find some entries in your data are Null, which isn’t useful for creating a meaningful visualization. To filter out certain values in your data, Command+Click (Control+Click for Windows) on the data component and drag it into the filter box in the middle pane. Under the “general” tab, the “select from list” button allows you to view a list of all your data fields and toggle them on or off.
It takes a little time to experiment with component combinations and filters, but Tableau makes it intuitive with their clean UI. Tableau’s biggest advantage over popular spreadsheet programs like excel is really its ease of use. Parsing through a massive dataset can be done quickly and creating a visualization for your data is never more than a click away.
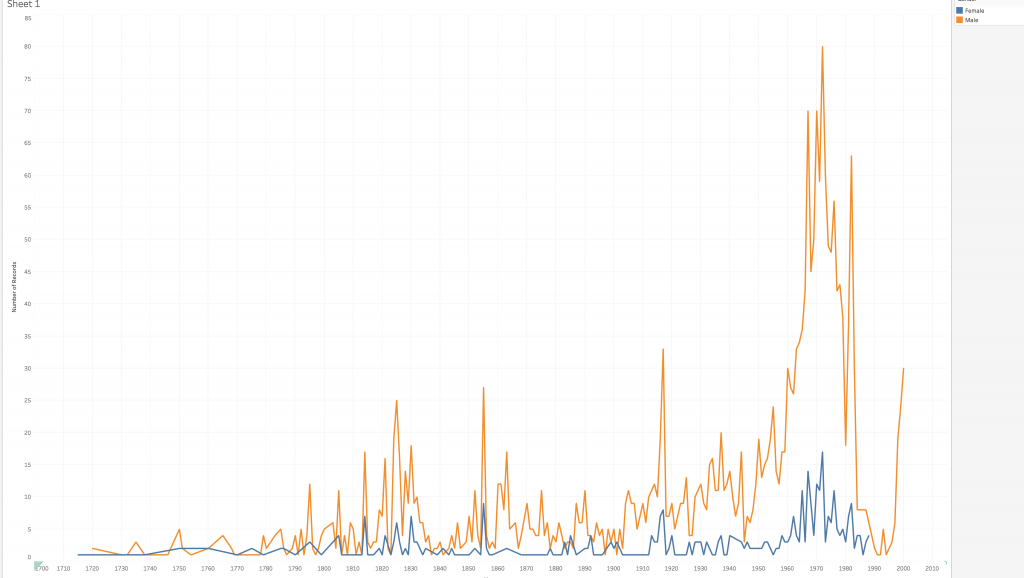
I was able to create a simple visualization relating the number of works by year, separated by artist gender. By just looking at the graph, you can begin to understand the gender disparity representation in Tate’s collection over the past 300 years. Visualizations like this are of great value to those in humanistic research. They not only pose questions about your data but also answer important questions about hidden relations in the dataset. With Tableau, you can quickly clean, correlate, and visualize your data in an easily comprehensible and sharable format. Thus, it is a great asset to digital humanists concerned about maximizing the usability of their data.
For more resources on Tableau, visit:

Your tutorial is very nicely set up and explained. Also the example project you show is really cool, thanks for sharing!