Progress
This week, our group focused on solidifying the direction of our project. We decided on the terms we would be tracking, which in most cases were inspired by historical or campus events (such as World War II or when alcohol was first allowed on Carleton’s campus) and the events we hoped would correlate with these terms. We then began to collect data concerning frequency of these terms, which is where we are right now. We intend to have data collection one by next Tuesday.
Tools and Techniques
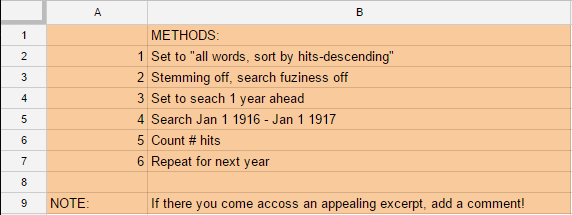
The methods we used in collecting word frequency data
While exploring the Carletonian digital archives, our group learned about the limitations of the database–for instance, it’s nearly impossible to search the data with third party software or algorithms. This meant that, to find our data, we had to go through each year manually, searching for a single word at a time. Although this is somewhat time-consuming, the search interface of the database makes it relatively easy to do this. This also allows us to see the context of the words we are searching for. By glancing at the Carletonian excerpts while searching this way, we have been able to find excerpts that are relevant to include in our analysis. For example, finding a light-hearted use of the word “ration” might allow us to make claims about the effect of rationing during the Second World War on Carleton’s campus.
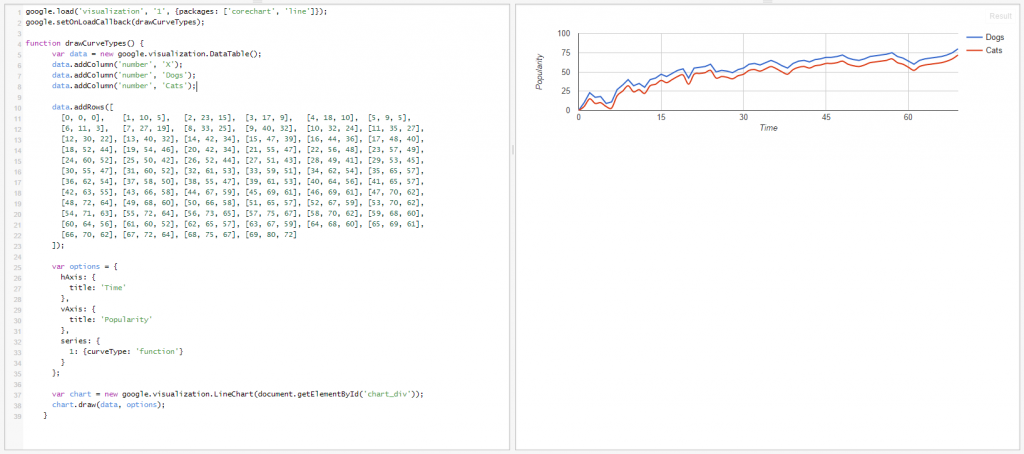
The code and resulting graph using Google’s chart tools
Currently, we are using Google Spreadsheets to organize our data–this is only for convenience, though, and will change to something which works well with the timeline software we’ll be using. After some exploration, we’ve found this tool, made by Google, which allows for the creation of interactive timelines. This timeline is relatively simple–there is only a little bit of code, which should be easy enough to manipulate, although we would need to manually enter our data into a “code-chart.” Considering that we’ve been manually searching through the archives, year by year, this seems like a small price to pay for a very slick final product.
Problems
As explained above, we had to adjust our methods to a manual approach, but this has been effective so far and has allowed us to engage more with the material than a text analysis program would. Still, the Carletonian database remains a bit unfriendly as we have found that some files have not been transcribed accurately. We can’t change this, but we can account for it in our analyses– for one, we have investigated how frequently files are not transcribed correctly, and it seems that the vast majority are correct. We also plan to take a transparent and self-reflexive approach to our methods by addressing the limitations caused by the database in a written section of the project.
Additionally, we have had to make decisions about the specific word choices and their derivatives. For example, in examining discussions of rationing over time, we had to decide whether to search for “ration,” “rations,” “rationing,” or another form of the word. “Stemming” is another option, which allows for the inclusions of derivatives of the search term, but for some words this leads to more error– in the case of “ration”, irrelevant words like “rational” would be included. So far we have been addressing this issue on a word-by-word basis, and in some cases it has been an asset to the analysis: for instance, when searching for the word “arboretum” we got the idea to search for both “arb” and “arboretum”, and to compare these two to see if usage of one surpasses the other. In this case, the variation of the word is not a stumbling block but a chance to examine Carleton vernacular.
Deliverables
Our revised timeline for Wordline looks like this:
Oct 20th: Words/word groups and historical events being tracked should be chosenDone!- Nov 3rd: Completed spreadsheet with word frequency by year; graph abilities and methods fully explored
- Nov 10th: Graph/timeline complete; explanations of trends finished. Work on presentation this week
- Nov 17th: Finished polished Wordline! All chosen graphs with analysis are done, along with presentation
Our group has gotten slightly behind schedule, but this isn’t a big problem because a lot of flexibility was included in the original schedule. Since we’ll be working throughout the week, there’s definitely going to be some fuzziness with these dates depending on our availability to meet.
Your project seems to be coming along very nicely! I think this is such an interesting topic, as it tells you a lot about a particular time period. My group also experienced some limitations of the online database. I see your frustrations in the use of specific word choices and their derivatives, but I like how you turned it around into an opportunity to explore the vernacular. I wonder if there are any potential ways to get past that which differ from your current methods. The way you organized this post was easy to follow and the visuals your provided helped the reader understand what you were talking about. Can’t wait to see what you find!
I really appreciate the way you described the problems and struggles of the group. I think the project will turn out great; I’m excited to see the final deliverables!
Just out of curiosity, why is Google Spreadsheets not very compatible with the timeline software y’all are using?
Hey Clarissa! It’s not exactly that it’s not compatible, it’s just that the charts we found use their own table, created inside the code rather than a table from an outside file. If you look at the picture of the code, there’s a whole list of bracket-contained lists of three items ([0, 0, 1], [1, 1, 2], etc.) inside the actual code for the table. We’d just have to transcribe our data into this format.
I think you’re really taking a good approach to your project! As interesting as this topic is, I can tell that your group is really fascinated and constantly looking for more effective method. The post for the project is well organized and easy to follow. By the way, having a schedule shows that your group is very timely managed. I hold high expectations for the outcome!
My group faced similar problems with the Text analysis. We were planning on using information from the Carletonian for some information about where students come from but it’s a bit unfriendly.
I hope all works out for you guys because this sounds like a pretty awesome project.
This is a great blog post! I appreciate how thoroughly analytical your group is being, and I am really interested in seeing if you find any conclusive trends! I found the discussion of your problems and proposed solutions particularly interesting. Best of luck continuing!