As I sit down to do my homework for my Cross Cultural Perspectives class, I stumble upon a database full of pictures of inscriptions found in Israel and Palestine dating back to 500BCE. My first thought is, “Awesome, this is just what I needed. How neat that people can share these types of things these days!” On the other hand, my mind also wonders into the realm of questioning the work that was goes into it, and what I need to do if I ever desired to replicate this. As I get cracking on my next assignment for Hacking the Humanities, I found that my questions have been answered. My first task was to watch a video by Miriam Posner, the Digital Humanities coordinator at UCLA. In her video, How Did They Make That, Posner describes how we, as a community, can all use digital humanities projects to their full potential.
She begins with the concept of Reverse engineering, which is comprised of taking a project, breaking it into it’s component parts, and beginning to understand how it was built. By using this skill, you can benefit in a couple ways:
- You can begin to model your own projects
- You can evaluate and gain a better understand of those of others.
Digital humanities, or DH, projects that are made in various forms. A few popular ones include:
- Exhibits
- Digital editions
- Mapping projects
- Data visualization
- Text analysis
- 3D imaging
- Multi-media narratives
When looking a project, one must break it down into three categories. The sources (information given), process (making the acquired information machine readable), and presented (human viewable). More specific examples of each of the three include:
Sources:
- Collections of works or data that you wish to make available online
Processes:
- Changing data into numbers, algorithms
Display:
- Making the project visible on the web and making the data interactive. A few methods include making it mappable and searchable
To gain a better understanding of this idea, I decided to explore one of the many DH projects that are currently up and running: Google books Ngram Viewer.
It is “a mammoth database culled from nearly 5.2 million digitized books available to the public for free downloads and online searches, opening a new landscape of possibilities for research and education within the humanities.”
–Patricia Cohen, “In 500 Billion Words, New Window on Culture,” The New York Times
In other words, it is a collection of data sets showing words and short phrases and a year-by-year count of the frequency of their appearance in literary works. This easily accessible online tool allows anyone with a computer, regardless of age or scholarly level, to have the ability to browse and analyze language and cultural trends throughout the decades.
Once at the webpage, I was presented with a graph of the use of the names Frankenstein, Albert Einstein, and Sherlock Holmes throughout the ages.
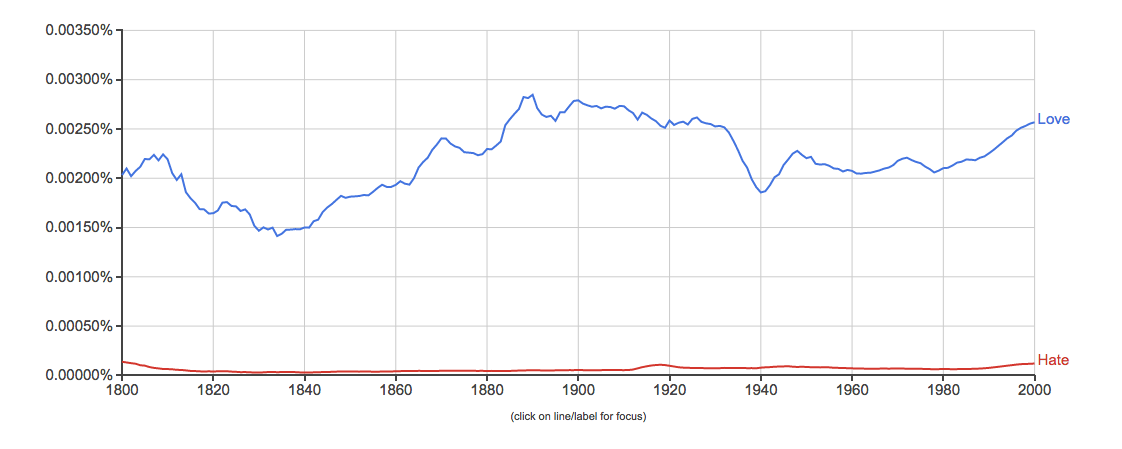
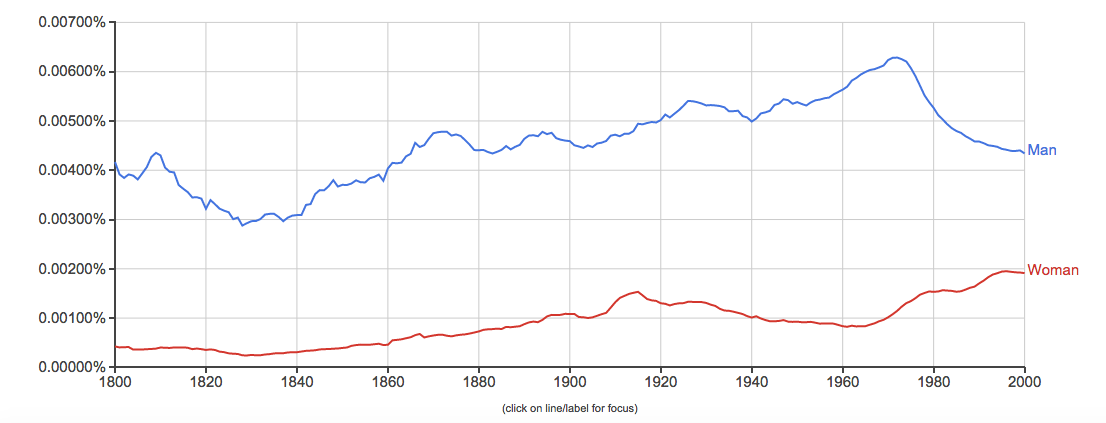
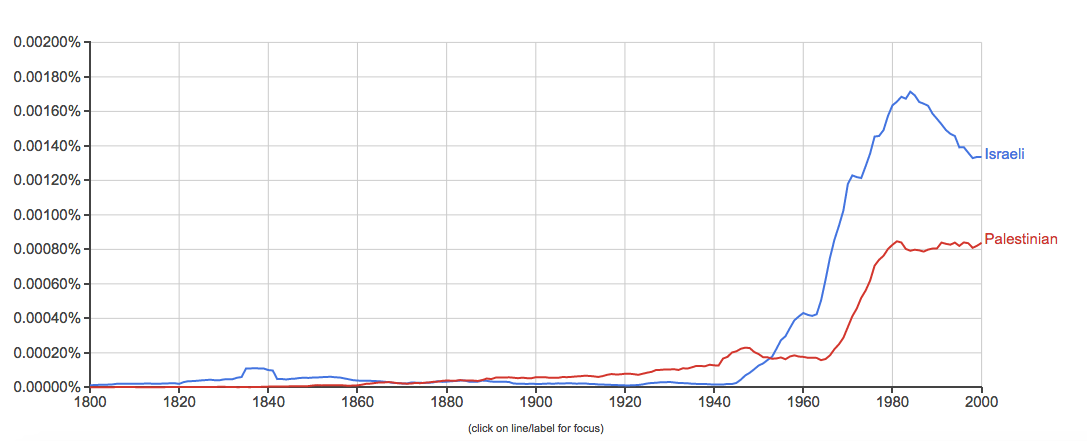
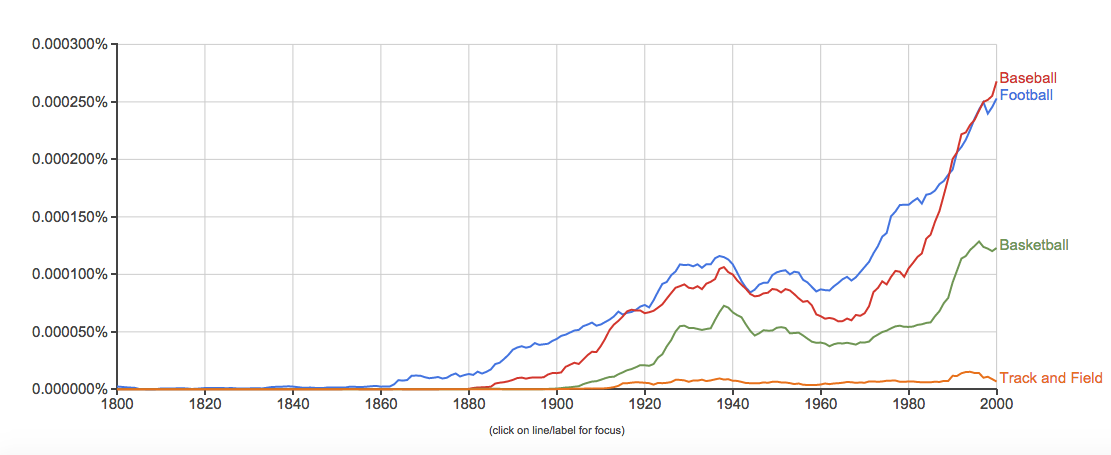
After poking through the primary features of the tool, I was able to pick words of my choice and uncover the relationship between them:
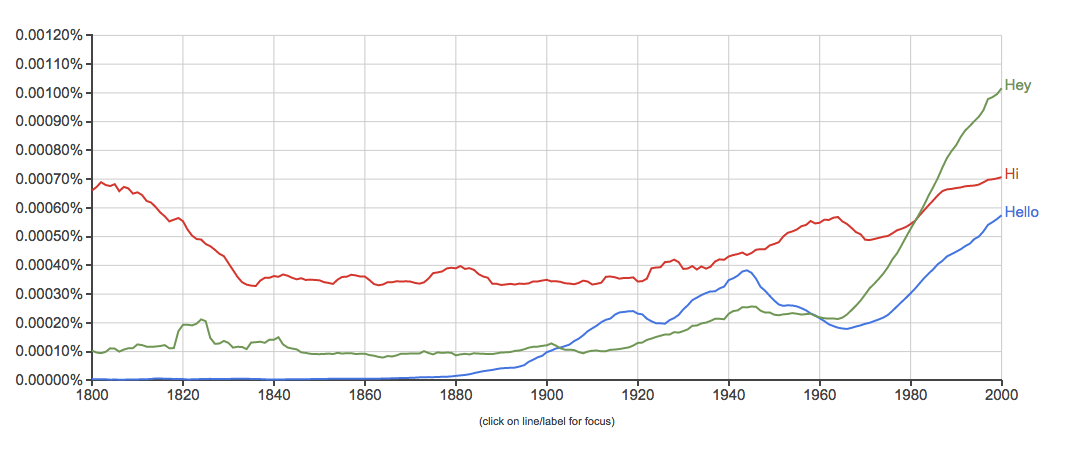
4. Baseball, basketball, football, track and field
I then began to reverse engineer the source by doing investigating the identification of Google books Ngram Viewer’s sources, processes, and presentations. My findings were:
- Sources (assets):
- It consists of over 500 billion words that were found in books published between 1500-2008 in languages such as English, French, Spanish, German, Chinese and Russian.
- optimized for quick inquiries into the usage of small sets of phrases
- It consists of over 500 billion words that were found in books published between 1500-2008 in languages such as English, French, Spanish, German, Chinese and Russian.
- Processes (services):
- The files that were used:
- were diverse in size due to the fact that certan patterns of letters are more common than others. An example that was given in their description was, “the “na” file will be larger than the “ng” file since so many more words begin with “na” than “ng”.
- Files with a letter followed by an underscore (e.g., s_) contain ngrams that begin with the first letter, but have an unusual second character.
- They also chose to include separate files for ngrams
- that begin with punctuation or with other non-alphanumeric characters.
- in which the first word is a part of speech tag (For example, _ADJ_, _ADP_).
- In Version 2 the ngrams are grouped alphabetically, while in Version 1 the ngrams are partitioned into files of equal size.
- In addition, for each corpus they gave a file the name of total_counts, which recorded the total number of 1-grams contained in the books included. This file was “useful for computing the relative frequencies of ngrams.”
- The files that were used:
- Presentations (display):
- A graph that displayed word frequency use over time
Google books Ngram Viewer also makes their data sets available for download, which allows users to build their own search tools. Now it’s your turn! Either utilize or build off of all that Google books Ngram Viewer or any other DH project out there has to offer.
I think this helps to clarify how digital humanities projects work in general — you did a great job at breaking things down into the different sections of the structure. I particularly liked your definition of ngram in the processes section, since it went into more detail than the average user might encounter just using the site itself.