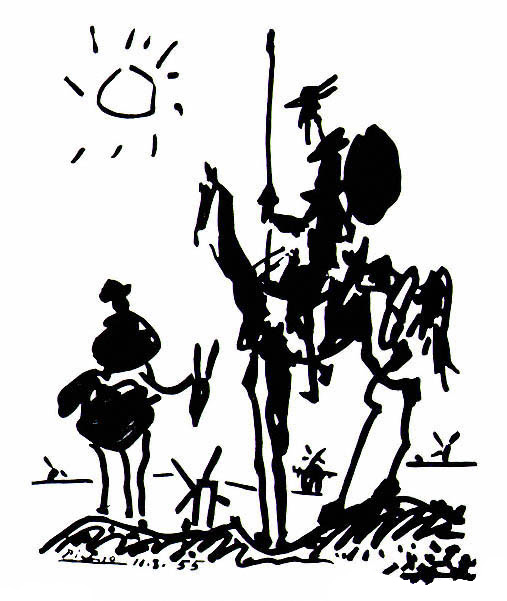
Don Quixote sketch by Pablo Picasso
The digital humanities project Quijote Interactivo created by the National Library of Spain lets users experience the classic novel, Don Quixote, in a new way.
The project’s main feature is high quality scanned images of the novel’s original first edition. This is the main data, otherwise known as a source or asset.
The data is presented in a very user friendly display. Clicking on the question mark in the bottom right corner of the screen prompts a brief tutorial explaining how to use the project.
There is a search option that allows users to search for individual words within the 1000+ page book. This is possible because of the text transcription. The word will appear in red letters and users can click through all the pages containing that word.
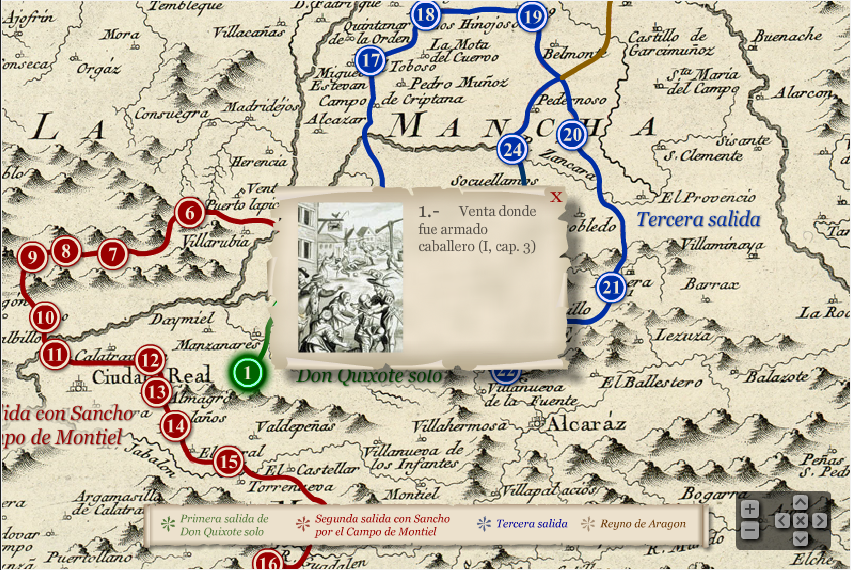 Another data source is a map displaying a portion of the Spanish kingdom. The map shows the route Don Quixote traveled and marks the locations of his adventures. The map was sketched by the geographer D. Tomas Lopez and D. Joseph de Hermosilla. The two men were the first to propose the novel’s route and their findings were published in the 1780 edition of the novel by the Real Academia Espanola, Spain’s official institution that oversees the spanish language.
The map displays points numbered 1-33. The points are connected in one continuous line and color coded to indicate which parts of the journey are from: his first solo trip, his second trip with Sancho Panza, his third journey, and the part of his journey in the Kingdom of Aragon.
Clicking on each point reveals a box with an image and short description of the scene that occurred in that location. Click on the image to try it out!
In addition to the project’s map and searching tool, there are other editions of the novel, video and sound clips, and an overview of the culture during the novel’s time period. Users can even share pages of the book on social media platforms like facebook and twitter!
The process to create these services from the data took over 5,000 hours of work by over 30 professionals ranging from librarians to programmers. To read more about the process of the project, click here.
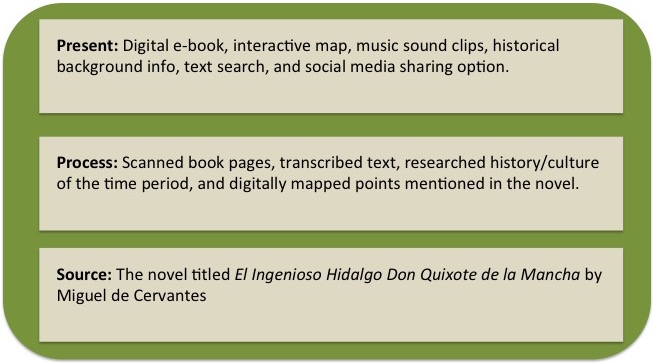
Miriam Posner defines the components of a digital humanities project in this video. She uses a black box to identify the Sources (data), Process (what’s done to the data), and the way the digital humanities project is Presented. Take a look at the green box breakdown of the Quijote Interactivo project components, below.
This was a really fascinating post, which inspired me to look into the website itself. The tools you mentioned particularly interested me:
I looked particularly at the timeline, which I thought was a really cool way to present the different editions of the book.
I found that the way you reverse-engineered this project
was really great .You broke it down clearly, and I specially enjoyed the black box at the end. I liked how resourceful you were in trying to obtain all the information, even reading articles in Spanish