Google is letting users experience culture in an entirely new way with their Ngram Viewer. This simple online tool allows humanities scholars to use a tool they may be unfamiliar with: word frequency analysis.
Users can use the search bar to enter up to five words in a string or multiple words separated by commas. The viewer then graphs the use of those words or phrases any time between the years 1500 and 2009. Users can switch between a variety of different corpora, including French, German, English, Russian, and Spanish.
For instance, entering ”socks, stockings” shows that there is a huge uptick in the use of the word ‘stockings’ during the early 1600s in comparison to ‘socks’, which only recently has shown an upward trend of usage.
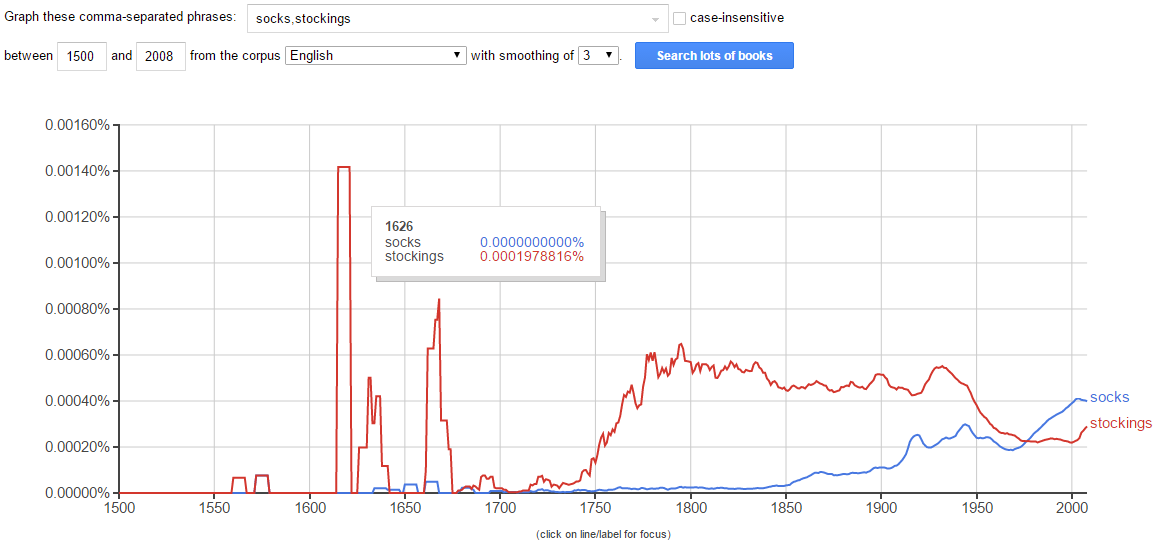
This text analysis can provide a valuable insight into cultural trends and popularity of certain words in a historical context. Knowing that the etymology of stockings says the word was introduced the late 1580s, it makes sense that there would be a general uptick in mentions shortly after in literary texts.
The Ngram viewer is named after the way that words are input into a system and then checked for relative occurrence in the texts, called ngrams to denote a collection ranging from unigrams to trigrams and so on. A word like “cats” would be a unigram, while a phrase like ”cats meow” would be a bigram of two contiguous words. The graphs allow for the number of times the word or phrase occurred to be listed, as well as relative occurrence depending on the time period. Since only 500,000 or so books were published in English before the 19th century, the graph accounts for this and shows more frequent spikes of searched phrases in earlier years. Using the smoothing feature allows to show for a trend’s movement over time, rather than just raw data.
Google uses complicated statistical models to extract this data from books that they have digitized in their Library Project, which works with around 40 libraries worldwide in a collaborative effort to upload and categorize books. The project itself requires use of a scanner specifically developed by Google that uses two cameras and infrared scanners to scan 1000 pages per hour without damaging the original text. The books that are currently available are limited to only the texts that the participating libraries use, but Google estimates something like 20 million books have already been scanned into their system.
The possibilities for this application are endless, making it easy to track cultural trends or ‘culturomics’ in the current Google library. While the Ngram viewer can’t provide reasons why certain trends go in or out of vogue, it shows raw statistical data that historians can infer from or make educated guesses about. It adds another piece of the puzzle that helps form a more complex storied history and provide statistical backing to already well-known pieces of cultural information or memes.
This project is very impressive! I believe it was Kurt Vonnegut Jr. that said