For any sort of textual analysis project, DHers need to spend LOTS of time cleaning the data first before they can analyze it or create meaningful visualizations. Today we are going to pick up on the tools we saw briefly last time, step through the process of taking a data table of art history data and cleaning it up, and then turn it into a nice looking visualization as an interactive timeline.
There are many many MANY ways to do this kind of data manipulation from code based solutions (most commonly in DH and data science circles using the Python or R languages), to simply using find and replace in spreadsheets like MS Excel or Google Sheets.
We are going to use OpenRefine to clean our data, which we will then import to a Google Sheet to create a timeline in the KnightLab’s beautiful TimelineJS framework.
As we saw briefly last time, OpenRefine is like a spreadsheet program but with extra special features that let you perform batch operations to clean data and turn messy OCR’d or scrape text into nice regular tabular data.
Here are the data manipulation tasks we will take with OpenRefine
- Clean up spelling inconsistencies
- Remove extra white space
- Format dates and numbers using regular expressions
- Extract and combine values
Note: Extracting Text from PDF
We are starting with table data here, but many projects will first need to pull data from PDF files using Optical Character Recognition. There are many ways to get OCR’d text out of a pdf, from APIs to python utilities to copy/paste. If you are on a mac, one of the easiest is to set up an automator script to generate output from any PDF you drop on top of the application.
Cleaning Data with OpenRefine
1. Install OpenRefine
Head to www.openrefine.org/download and download OpenRefine. It’s available for Windows, Mac and Linux
NOTE: If you’re on a Mac and, when you try to open OpenRefine, you get a message saying that you can’t open software from an unidentified developer, do the following: right-click the program and choose Open, then click Open again.
2. Download our sample data
We are going to be using a sample dataset developed for an “Introduction to OpenRefine,” tutorial developed by Owen Stephens on behalf of the British Library. We will use the same data, but do slightly different things with it today.
- Download the data from github here
BL-Flickr-Images-Book.csv - Save it to your hard drive as a .csv file to import into OpenRefine
3. Clean data in Open Refine
We will walk through the steps together but this is what we are going to do, along with some text you’ll need to copy and paste to get going
- Import the data and create a project
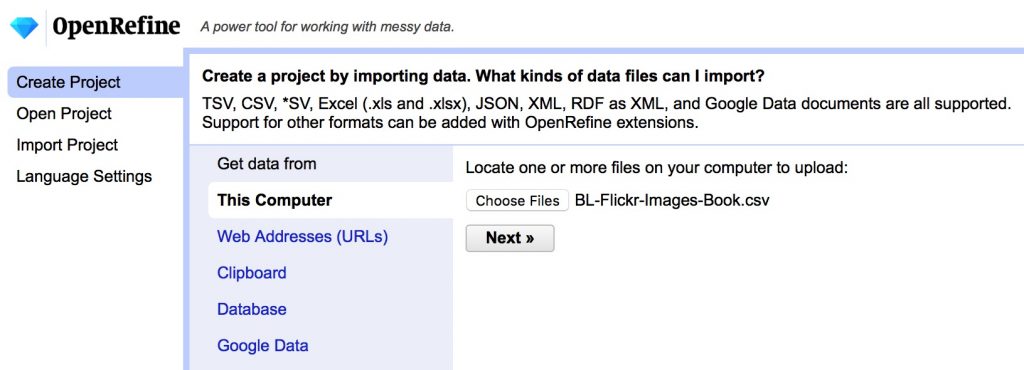
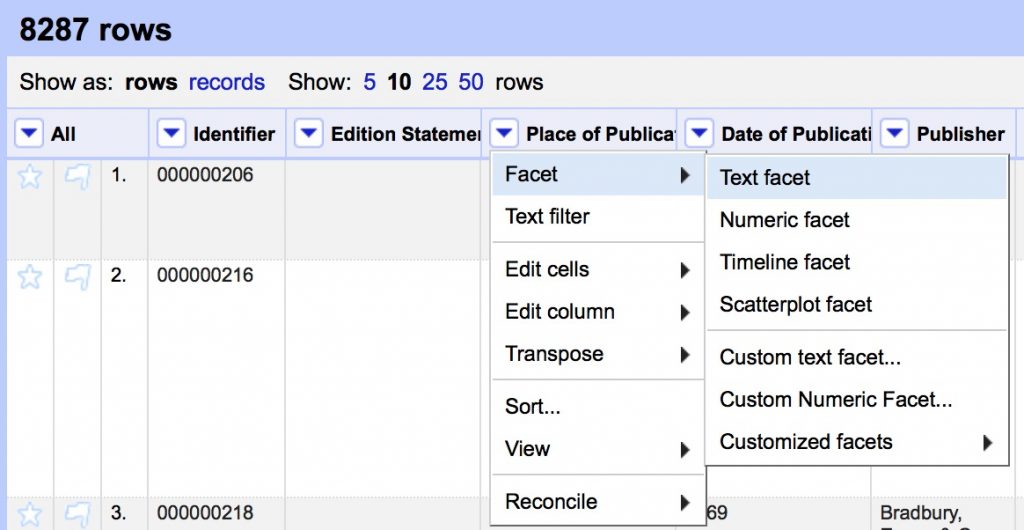
- Create a text facet on Place of Publication field
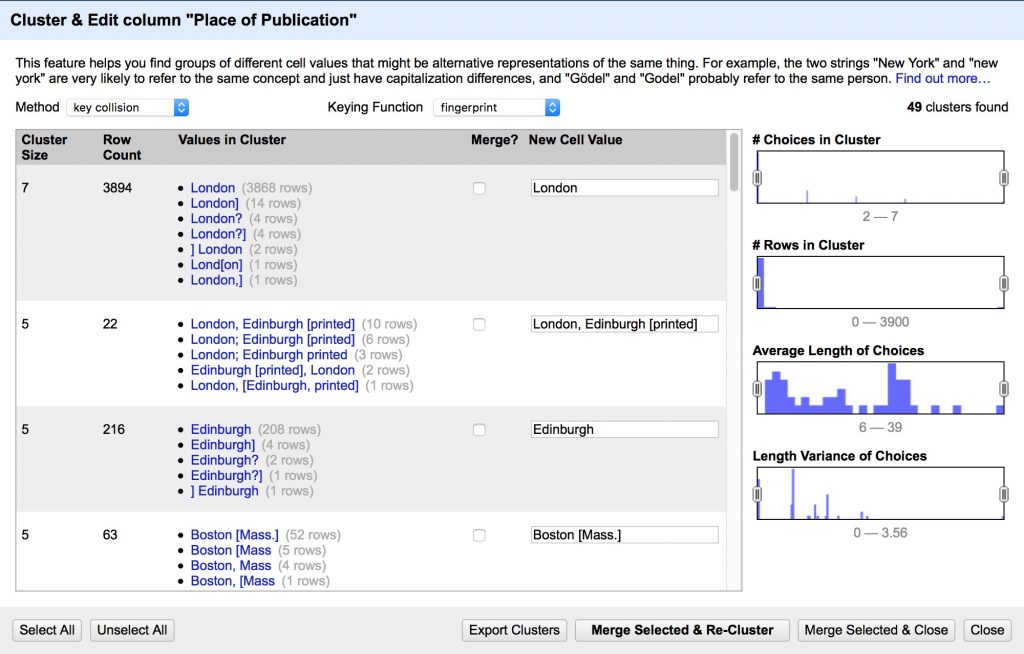
- Cluster the Place of Publication field to clean up inconsistencies
- Review the suggested clusters, choose the best New Cell Value, Merge Selected & Re-Cluster
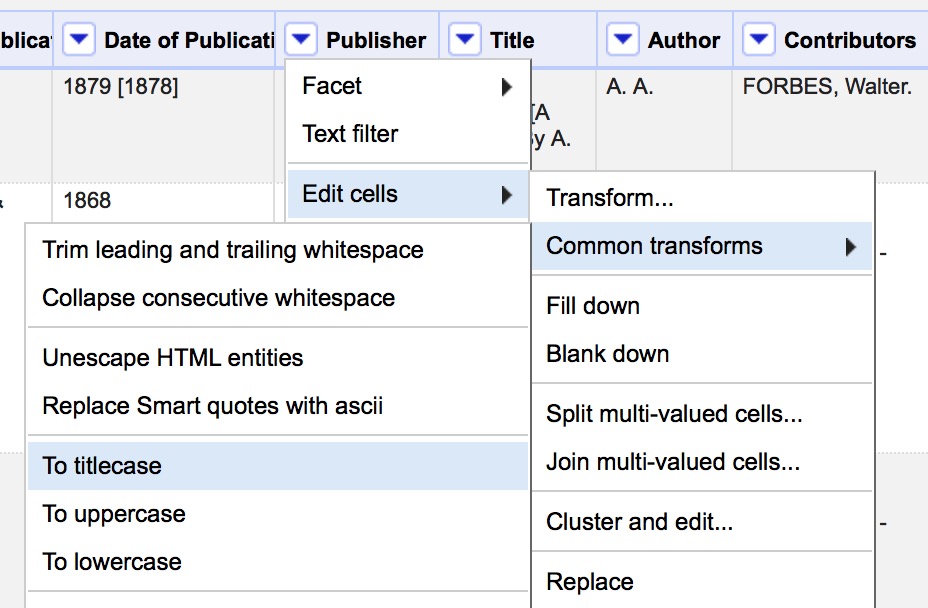
- Use Edit Cells > Common Transforms to
- Convert all values in Publisher field to Title Case
- Remove leading and trailing white space
- Clean up the Date of Publication column so that we can create a timeline. We will do this using custom text transforms and regular expressions (see below).
- Create a text facet on Date of Publication
(we can’t use a numeric or timeline facet because of all the non number characters in this column “[]?” etc.) - Select All, Merge Selected & Recluster
- Now we need to clean up non-date characters by copy/pasting the following regex expression in the Edit Cells > Transform box
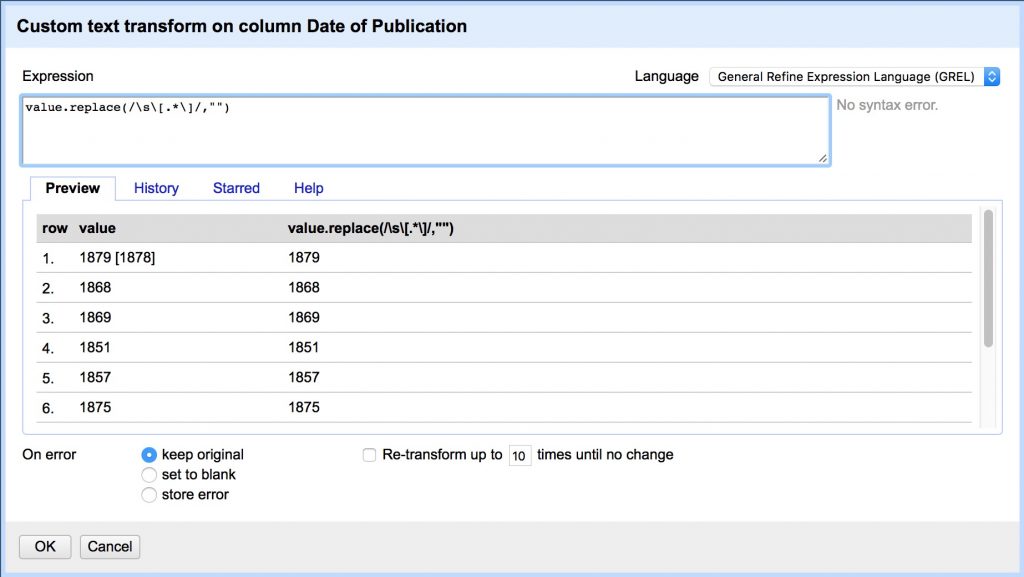
- Remove all secondary dates in brackets that follow the first
value.replace(/\s\[.*\]/,"")
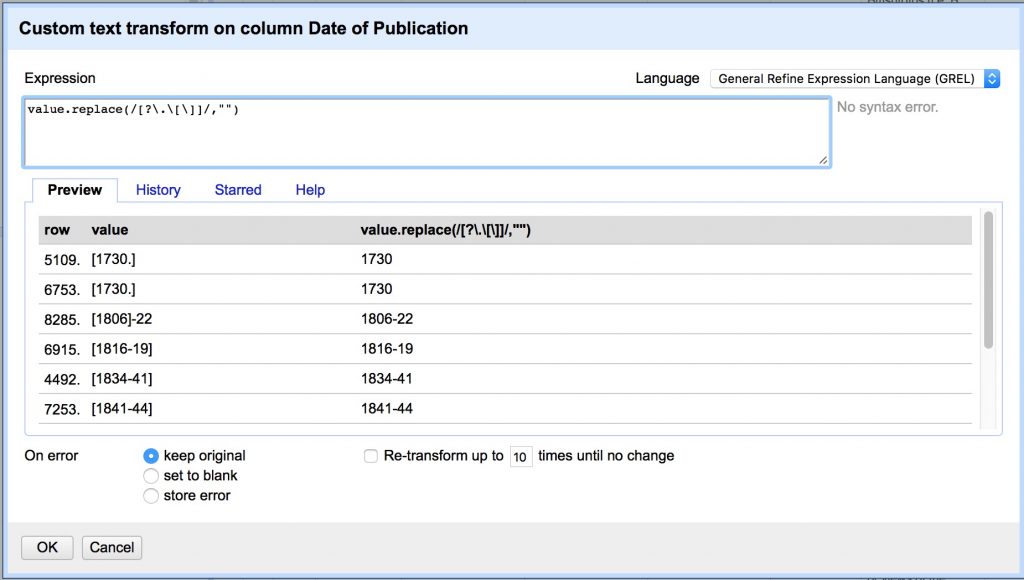
- Remove [].? characters.
(Note we have to escape .[] with backslashes because they have special meaning in regex)
value.replace(/[?\.\[\]]/,"")
- Capture groups.
- Group 1: any non-digit characters at the beginning,
- Group 2: the first 4 digit date,
- Group 3: any additional characters after that date
value.replace(/(\D)(\d{4})(.$)/,"$2")
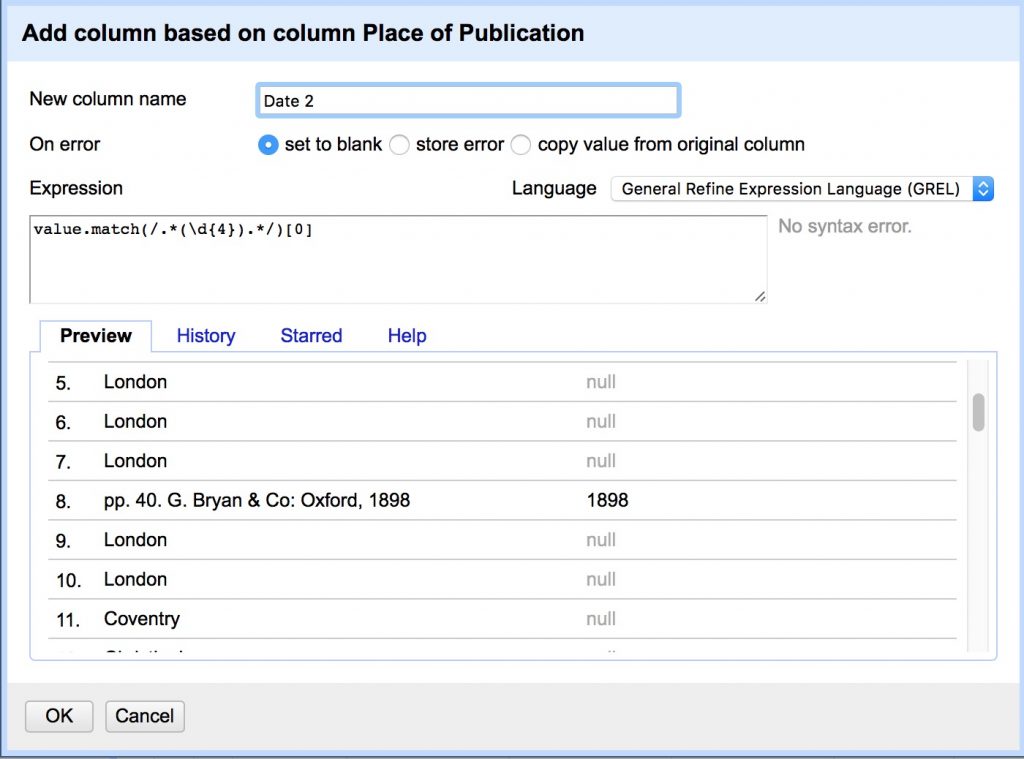
- Add column “Date 2” from column “Place of Publication”:
value.match(/.(\d{4})./)[0]
- Merge 2 date columns back into one
- Select all blank Date of Publication cells in the text facet
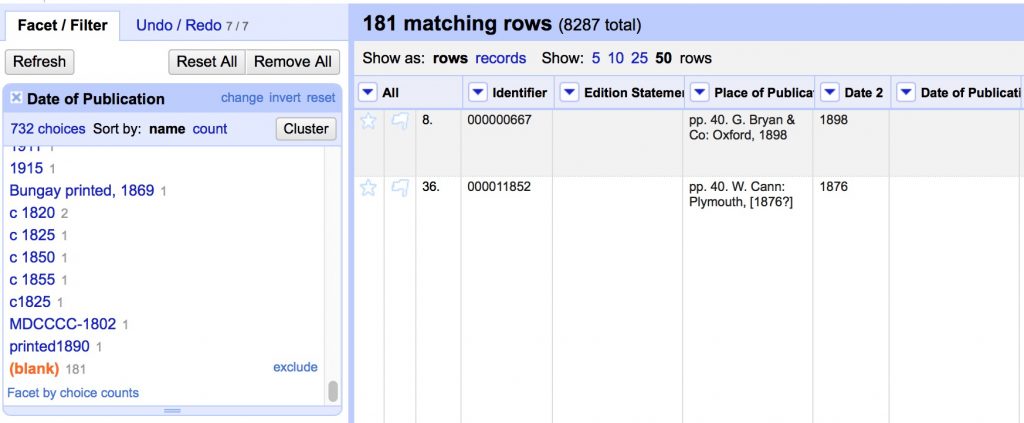
- Transform cells to move new values into original column
cells["Date 2"].value
- Remove “Date 2” column
- Edit column > Remove this column
- Edit column > Remove this column
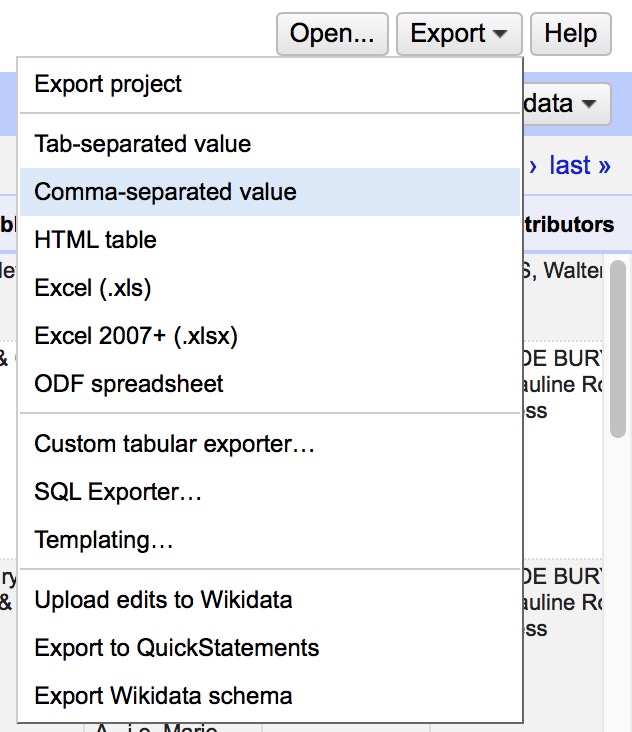
- Export CSV and you’re done!
Regular Expressions
Regular Expressions are a fantastically useful tool to match patterns in text to do advanced find, replace, and extract operations. They are implemented slightly differently in many different applications, but here are some general resources to get you started.
- RegExr is a great browser based tool to learn and try out regular expressions, much like paste bin sites like jsBin or CodePen that we’ve used for HTML, CSS and JavaScript
- Understanding Regular Expressions lesson from the Programming Historian
- A great introduction to the power of regex using advanced find and replace in LibreOffice
- Cleaning OCR’d text with Regular Expressions lesson from the Programming Historian
- A next level up in regex use, writing a python script to parse messy OCR’d data
- Regular Expressions cheat sheet from the TextMate text editor
- A handy go to guide for the most commonly used regular expressions
Visualization Project: Timeline
Now that we’ve cleaned up the “Date of Publication” field from the list of book images from the British Library, we can create an interactive timeline visualization with it.
One of the longest-running types of applications is an interactive timeline. We will do a class project to convert our flat spreadsheet into an interactive timeline using an easy to use application, but there are other tools that require more coding and show you how these work. Take a look at the SIMILE timeline tool for an example of one of those.
Export from OpenRefine
First, go back to OpenRefine project.
We are going to make a timeline of the books published between 1700 and 1800.
- Use Edit Cells > Common Transforms > to number on the Date of Publication field
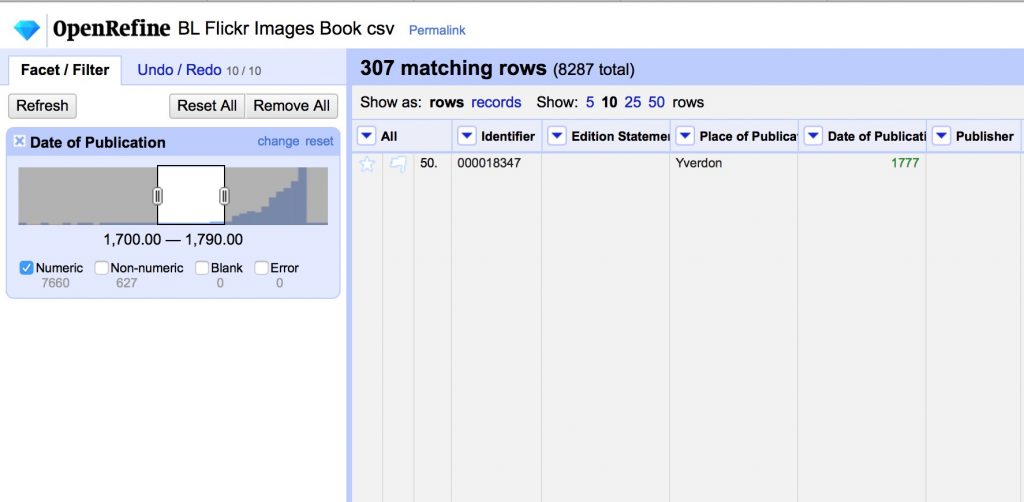
- Use the number facet on the Date of Publication column to select a range, and uncheck Non-numeric.
- We will split up the 307 records 1700-1790 into 30 groups of 10 each and each export a range as a csv.
Matching Data to Framework
One of the biggest challenges of using off the shelf platforms is figuring out how to map your own data onto the framework the app developers have set up. We will collectively figure out which data we will put where in the TimelineJS template.
- Go to the TimelineJS page and look over the 4 step instructions to Make a New Timeline
- I’ve already done Steps 1-3.
- Access the Google Spreadsheet Template copy here: https://docs.google.com/spreadsheets/d/1JxTGGQ_NZ4MM7HTMA3q2dRNxHn21eFt8TFdMQYjMR6I/edit?usp=sharing
- The live preview is embedded above, so as you add things you can refresh this page to see how your stuff looks, or launch it in a separate window with this link: https://cdn.knightlab.com/libs/timeline3/latest/embed/index.html?source=1JxTGGQ_NZ4MM7HTMA3q2dRNxHn21eFt8TFdMQYjMR6I&font=Default&lang=en&initial_zoom=2&height=650.
- Once you are setup, delete the template data and move over your personal date range from the BL Flickr images data set. The dates and captions should come over with an easy copy/paste, but then you’ll probably need to finesse the rest of the data a bit.
- You might need to change the number format of the Date columns to a different date display or even Number > Plain Text to get them to display and order properly
- All entries should have a brief headline that summarizes the text on that date’s card, which you’ll need to write
- Where there are images linked, you might need to finesse the site to get them to work.
- Where there are no images, see if you can insert a Google Map if appropriate.
- NB: All Media should have a Media Credit, which will usually be “British Library“
- Finally, explore what happens to the timeline when you use tags to categorize events.
If you’re in doubt or stuck, post a comment to ask a question and we’ll try to help each other out.
Text Analysis 101
Finally today we are going to turn to the broader and more fundamental question facing digital humanists: why should we mark up and use computational techniques on texts in the first place?
Computer-assisted text analysis is one of the oldest forms of digital humanities research, going back to the origins of “humanities computing” in the 1940s. Computers are well suited to data mining large bodies of texts, and with the rise of massive digitization projects like Google Books, many research questions can be answered using plain “full text” versions of documents. The Google Ngram viewer is probably the best known of these tools, allowing simple comparisons of the frequencies of words across Google’s enormous corpus of digitized texts. Someone interested in Prohibition for instance might compare the frequency of “alcohol” and “prohibition” in the American English corpus to see how the two terms were used during the period of its enforcement.
More sophisticated text analysis tools also exist that let you perform some pretty impressive data mining analytics on plain texts. Voyant Tools is one of the most well known and useful tools out there, that will permit some pretty impressive analysis and visualization on plain texts, but also allows you to upload XML and TEI files that permit fine tuning of your data. For how-to information, check out their extensive documentation page.
Exercise (Plain Text Analysis)
Let’s take a look at what these text analysis tools can do with a classic example text: Shakespeare’s Romeo and Juliet.
- Go to Voyant Tools, click the Open folder icon and choose Shakespeare’s Plays to load the open-access plain-text versions of all the Bard’s plays.
- Explore the interface, read the summary statistics and hover your mouse over various words to see what pops up
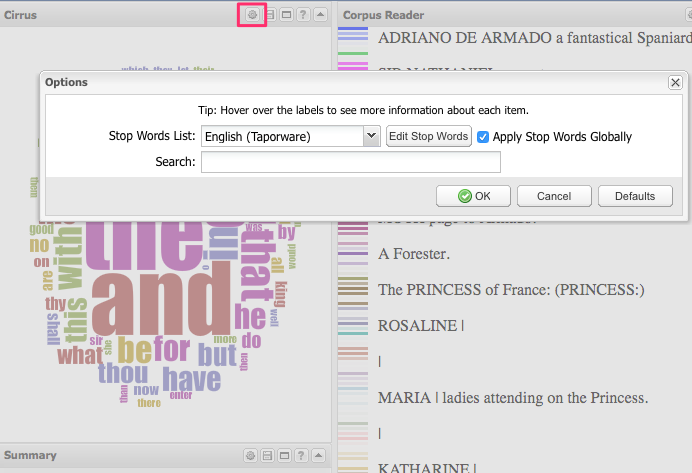
- What do you notice about the Cirrus tag cloud?
- To make it more useful, add a stop word list, “a set of words that should be excluded from the results of a tool”
- Click the gear icon to launch the options menu
- Choose the English list, which contains all the common short words, prepositions and articles in modern English. Since this is Shakespeare you’ll still be left with a lot of thees, thous, and thys, and if you wanted you could go back into the options, click “Edit Stop Words” and manually add more words to the list.
- Click on any word to launch more tools and investigate what they tell you and continue to explore the possibilities that Voyant offers.
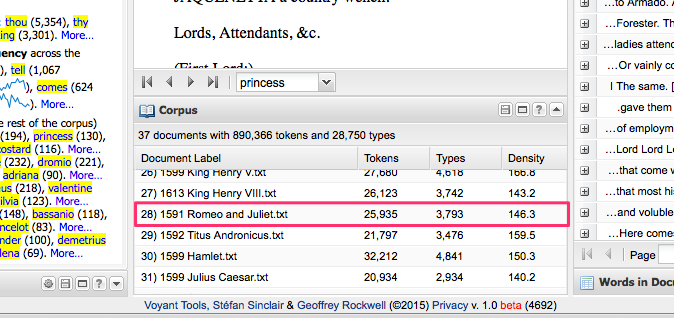
- Open the Documents window at the bottom, and click on Romeo and Juliet to load just that play’s statistics
- Investigate the Word Trends, and Keywords in Context tools to analyze some key thematic words in the play, like “love” and “death”
- There are a number of other analysis and visualization tools that Voyant offers, which can be accessed via a direct URL in the address bar.
- See docs.voyant-tools.org/tools/ for a complete list
DISCUSSION:
- What kinds of questions can you answer with this sort of data?
- Are there research topics that would not benefit from the approach?
Text analysis and data mining tools can get a lot of statistics out of the full texts, but what if we are interested in more fine grained questions? What if we want to know, for instance, how the words Shakespeare used in dialogues differed from soliloquies? Or what if we were working with a manuscript edition that was composed by several different hands and we wanted to compare them? For these kinds of questions, we need to go beyond full text. We need to encode our texts with meaningful tags. Enter XML and TEI.
For humanities projects, the de facto standard markup language is that specified by the Text Encoding Initiative. They have spent years working out a flexible yet consistent system of tags with the aim of standardizing the markup of literary, artistic and historical documents to ensure interoperability between different projects, while at the same time allowing scholars the discretion to customize a tag set matching the needs of their specific project. This flexibility can make it a daunting realm to enter for newbies, and we will not be going very far down this path.
The best gentle introduction to getting a TEI project up and running can be found at TEI By Example. For our purposes, let’s see how a properly marked up version of Romeo and Juliet differs from the plain text version and what that means for our scholarly pursuits.
Exercise (Encoded Text Analysis)
The Folger Shakespeare Libary’s Digital Texts is a major text encoding initiative that provides high quality digital editions of all the plays online for free. These are not only available online through a browser, but the Folger has also made their source code available for download.
- First, look at the online edition of Romeo and Juliet in formatted HTML.
- This provides a much nicer reading experience than a plain text version, mimicking the print edition, but adds search and navigation
- Explore these features and think about what this presentation offers compared to a traditional print version
- This provides a much nicer reading experience than a plain text version, mimicking the print edition, but adds search and navigation
- To see how they made this happen, download the XML source code and open it in the finder.
- Using your new knowledge of XML, XSLT, and CSS open the files in a text editor and try to make sense of them.
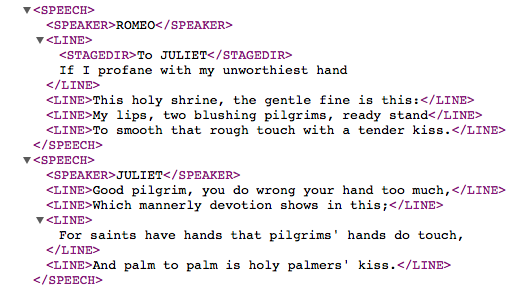
- For the XML file, you’ll see that this is much more complex than the RSS feed we looked at before.
- What elements have they tagged? How fine-grained did they get? Why?
- You may find their Tag Guide documentation helpful to understand what each element represents
- Using the guide, try to locate a speech by Romeo and another by Juliet.
As you might imagine, this kind of granularity of markup opens the door to much more sophisticated queries and analyses. Let’s say, for instance, that we wanted to compare the text of Romeo’s speeches with those of Juliet as part of a larger project exploring gender roles on the Elizabethan stage. The detailed TEI encoding of the Folger edition should let us do this pretty easily. Unfortunately the user interfaces for analysis of TEI documents have not been developed as much as the content model itself, and most serious analytical projects rely on statistical software packages used in scientific and social science research, like the open-source R. We’re not going to go that route for this class.
Voyant Tools will allow us to select certain elements of the marked up code, but only if we understand the XML document’s structure and know how to navigate it with XPATH (part of XSL and used in conjunction with XSLT). So let’s see how that works on our Romeo and Juliet example.
To do so, we’re actually going to use a slightly simpler XML markup version of Romeo and Juliet, so that it’s easier to see what’s going on.
- Go back to Voyant Tools and paste the URL below into the Add Texts box
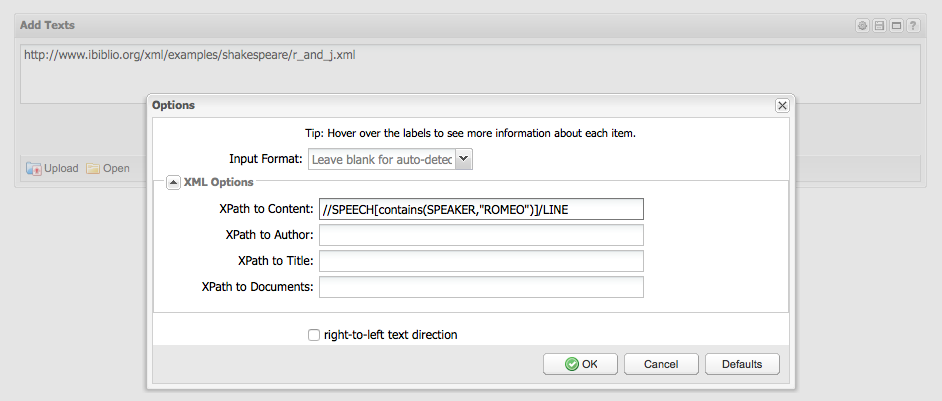
- Before you click Reveal, open the Options dialog in the top right corner
http://www.ibiblio.org/xml/examples/shakespeare/r_and_j.xml
- Under “XPath to Content“, type (or copy/paste) the following expression
//SPEECH[contains(SPEAKER,"ROMEO")]/LINE
- Let’s also give this document the Title of ROMEO
- Under “XPath to Title“, try to alter the expression above to select the SPEAKER values within Romeo’s speeches, instead of the LINE values
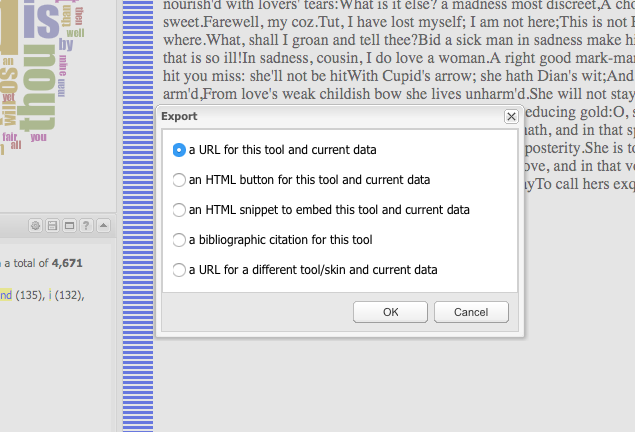
- Finally, click on OK, and then Reveal
- Apply your stop words and explore how this differs from the full text version of the play we examined earlier
I’m sure you can see the powerful possibilities afforded by using the encoded tags to quickly select certain portions of the text. When you do this type of analysis on an entire corpus, you can generate lots of data to compare with relative ease. So let’s compare Romeo’s text to Juliet’s
- To preserve Romeo’s text analysis, we can get a static URL to this instance of Voyant.
Now you can go back to the home screen and repeat the process above, making changes to the Path expressions in order to get all of Juliet’s lines and title the new document JULIET.
- Apply your stop words again
- Now you can use all of the analytical tools to compare the two lover’s words!
OpenRefine Resources
There are a lot of great resources for getting started out there, but here are a few to get you started.
- Miriam Posner’s introduction to OpenRefine
- A basic introduction to the tool, that will give you the key features for working from messy data that is already in a table
- Cleaning data with OpenRefine lesson from the Programming Historian
- A more in-depth exploration including using the GREL language to do more advanced programmatic cleaning
- Fetch and Parse data with OpenRefine lesson from the Programming Historian
- A power application that uses GREL to fetch URLs and parse web content into csv files