Categories
Uncategorized Week 4: Spatial Humanities

ArcGIS

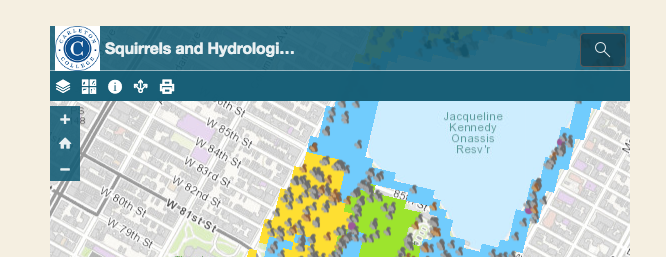
I didn’t realize that there was such a large difference in the squirrel populations, so the data set on ArcGIS was interesting to see. I had some struggles with ArcGIS at first, and it took some poking around to find various options and layers for the map. I was never able to find the “Enable […]

Categories
Assignments Week 4: Spatial Humanities

Midterm: Mapping Cushman’s Photographs

For my midterm I developed a geographic map, based on metadata obtained from github. of the locations in which Cushman took photographs from 1962 to 1963.

Categories
Assignments Week 4: Spatial Humanities

Squirrels, Subways, and Spatial Imaging

ArcGIS, with its mystical mapping powers and data-sharing capabilities allowed me to create my map. The map lies at the intersection of three very important things for any New Yorker (I would assume — I’m from CA): squirrels, subways, and and themselves. The map clearly and artistically displays the count and color of squirrels habituated […]

Categories
Assignments Week 4: Spatial Humanities

Squirrels and Population Diversity in NYC

Using ArcGIS Online and the data provided by the Squirrel Census, I was able to create a map that displays the population diversity index of humans in 2019 and the different colors of squirrels found in Central Park. Although this information doesn’t really correlate I had a lot of fun creating the map. I am […]

Categories
Assignments Week 4: Spatial Humanities

On Squirrels and Soil

Considering the fact I’d never touched GIS software before, it’s a bit of a miracle this map works the way it’s supposed to. Even more miraculous is the fact that I was able to embed it below. I believe both are testaments to the power of tutorials and persistence. Also helpful was the ability to […]

Categories
Assignments Week 4: Spatial Humanities

Mapping and Squirrels

A map that plots different squirrel sightings in Central Park as well as the average US household income in different areas. The data for the squirrel sightings was made public by Katherine Walden at Grinnell College. To create the map, I started with a base layer of a street map. I then layered the squirrel […]

Categories
Assignments Week 4: Spatial Humanities

Squirrel Park

A map of the distribution of squirrels in Central Park, New York. Created on ArcGIS and with a squirrel census data made public by Katherine Walden at Grinnell College. I changed the icon size in order to display the data in a way I felt held more integrity to the data, and configured the pop-up […]

Categories
Assignments Week 4: Spatial Humanities

Squirrels in Central Park

I have made an interactive map showing the density of squirrels’ population in New York’s central park alongside with the base map of New York city’s population density. By applying two different layers of data(one of them chose from online ArcGIS data set), I have clearly showed the two spices’ population comparison. The link below […]

css.php