About RStudio
RStudio is an integrated development environment (IDE) that provides a user friendly interface for programming in R. Similar to JavaScript, which we looked at briefly, R is also a programming language. R, however, is a procedural language and does not use object-oriented programming. This means that it follows a series of sub-routines to carry out a task. It’s more intuitive than most languages, but can be tricky if you are used to programming in python or Java as it does not follow the same rules. RStudio, specifically, provides help files and a way to write text code.
Why use RStudio?
R is primarily used by statisticians and data analysts to map trends and build models that describe large data sets and answer other data-driven questions. This is very useful from a digital humanities perspective as it can be used, similar to GIS, to illustrate trends and information that cannot be gathered from just looking at a list of data points. Plots and graphs can highlight associations between topics/variables and provides a way to communicate your findings to someone who may not be familiar with the topic.
Tutorial
Step 1
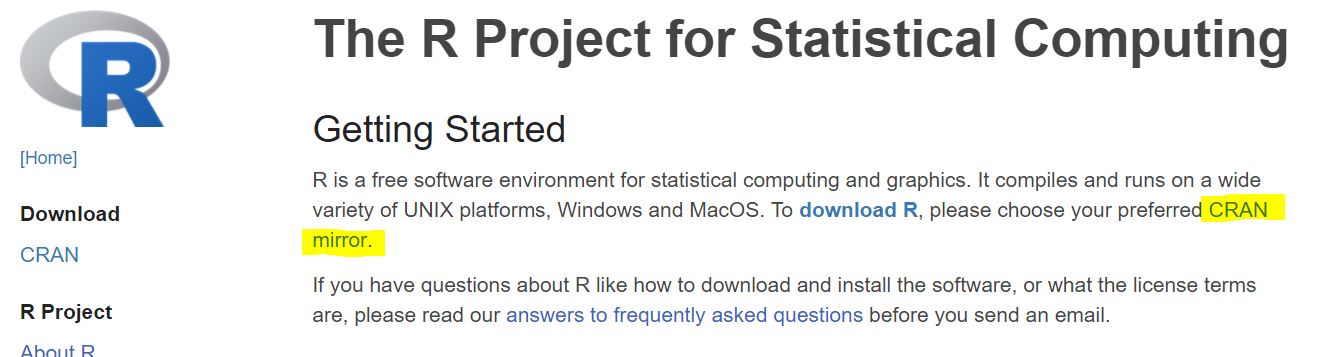
Click here to download R and here to download R Studio. Both of these tools are FREE! The Comprehensive R Archive Network has variety of mirrors hosted by different Universities, but they essentially all do the same thing, so just choose one and download R.
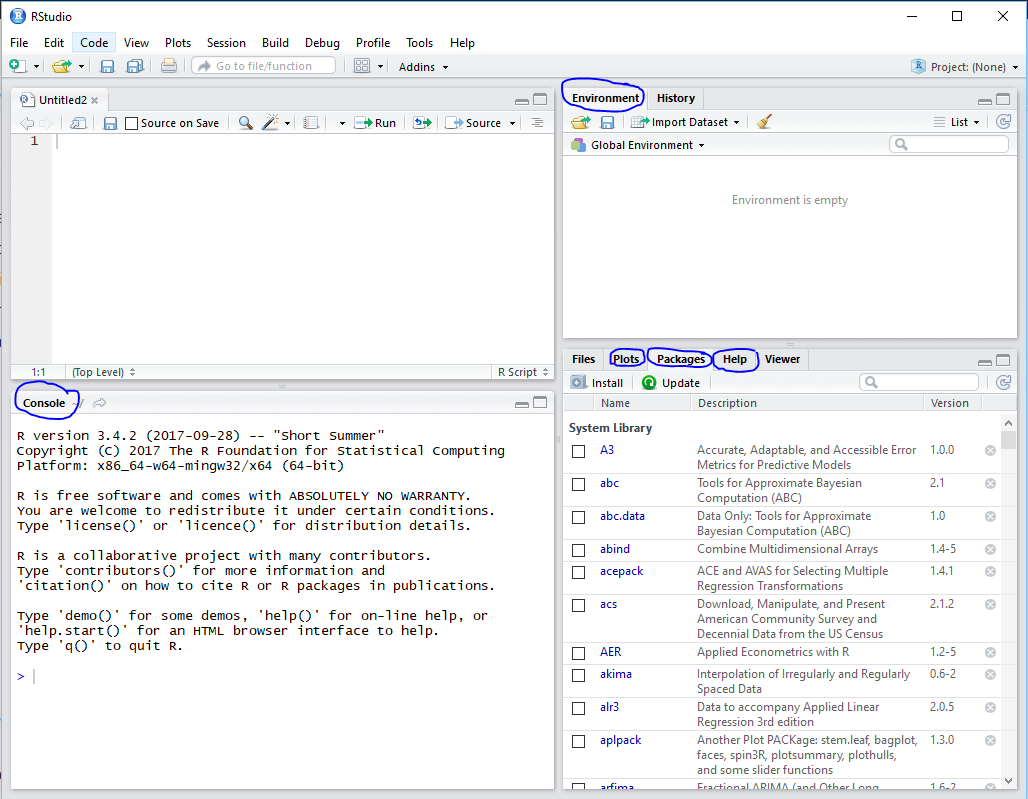
Step 2. Open R Studio and familiarize yourself with the layout.
A new R script file (top left) was opened as it is helpful to type code here and save if for later. The console, in the bottom left, is where you will type code. The top right is the environment where any files you read/import or variables or models you create will be stored. The bottom right has several tabs and this where any plots you create from the console will be stored.
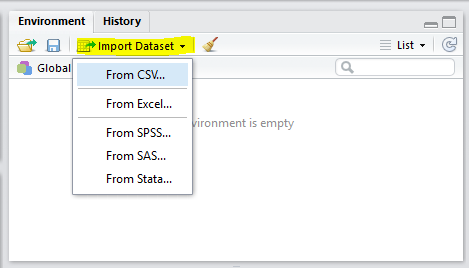
Step 3. Import your data-set.
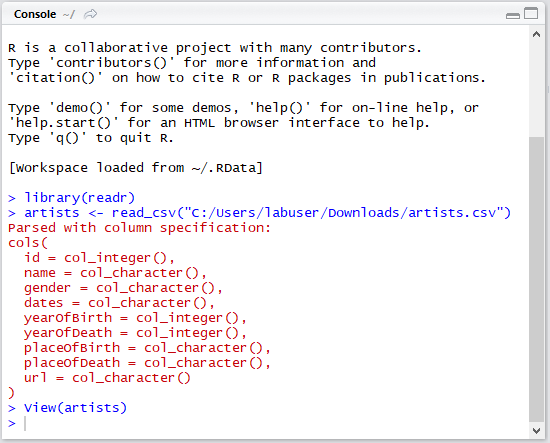
There are several options for types of files you can import, but most likely your file will be either a CSV or Excel file. Once you import the file it should appear in your environment. Note that you can also read your file from the console if you know the location of the file or if it is online (file name <- read_csv(“location of file.csv”). Also, notice that there are several commands on the console that can be used if you are unsure of how to proceed.
This tutorial uses the CSV file, Tate artists born in the 1860s data-set.
Step 4. Create plots to figure out what your data is saying.
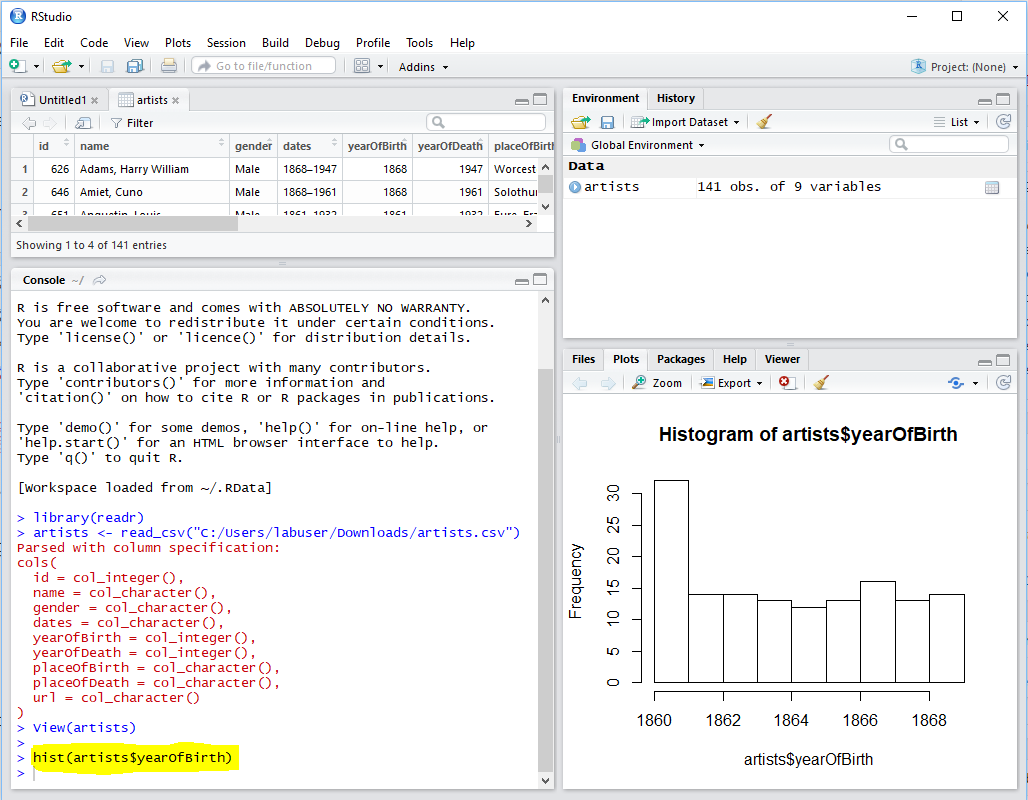
a. There are a number of ways you can create plot. First, let’s start with a histogram of birth years of the artists. To call a variable from the data set, use the syntax dataset$variable. Remember, R is case sensitive. R will output an error message that points out what is wrong with the code when you type a command incorrectly.
Type hist(artists$yearOfBirth) in the console and your histogram plot should appear under the plots tab.
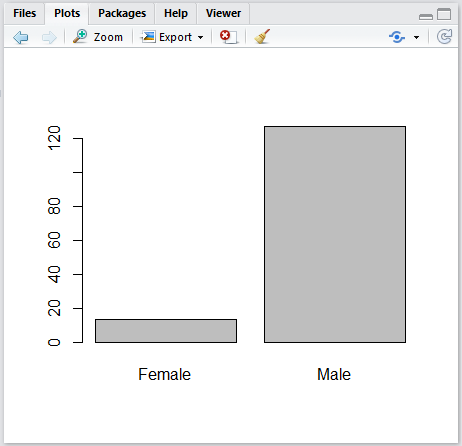
b. Now, let’s create a bar graph of the number of female artists and male artists.
Type barplot(table(artists$gender)) into the console.
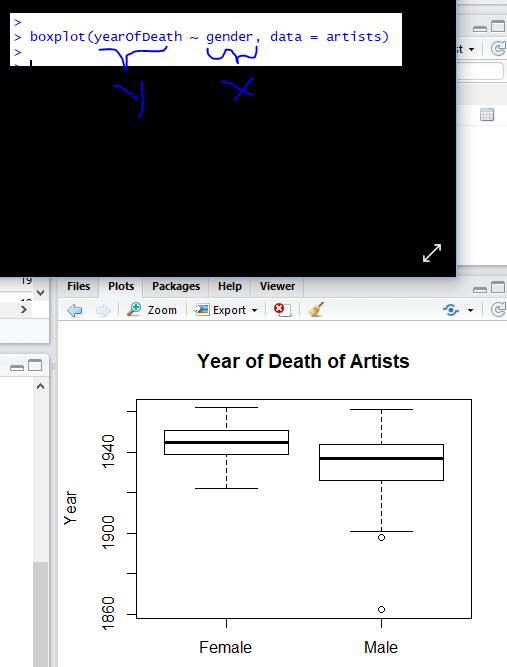
c. Next, create a boxplot of year of death grouped by gender. Follow the command typed below. Many commands in R take this form (Y ~ X, data = dataset).
Step 5. Save your work.
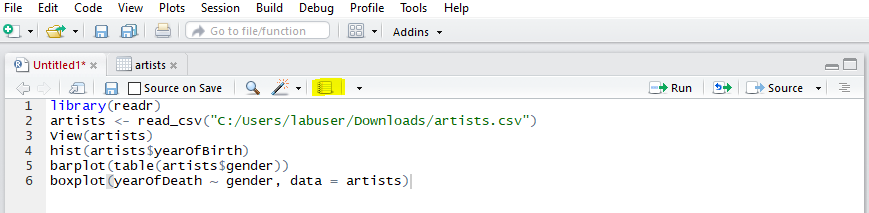
Copy and paste the commands you have typed into the R script file you opened earlier; or open an R script file (File –> New File –> RScript), if you haven’t already. It is usually easier to type in R script and run the code from there rather than the console, but it is important to get acquainted with the console first. Save the file like any other file, but note it will be saved as a .R file, so it can only be opened in R. If you want to print or open the file with other applications click on the compile report button (highlighted in yellow) and choose to compile the report to either a word document, PDF, or HTML file.
Congrats you can now compile a report containing diagnostic plots in R!
The following resources contain more information:
R Studio’s Official Tutorials –> https://www.rstudio.com/online-learning/
Stackoverflow with FAQ’s about R –> https://stackoverflow.com/questions/tagged/r
The help tab in RStudio also contains various links to resources including cheatsheets.
R sounds intuitive, especially if you already know another programming language before! I think we kind of did similar tutorials, but I focused on a tool with little (or no) coding; it is interesting to see another tutorial for people who either have scripted in R before or in any other language.
Nice work Saahithi! A concise and clear introduction to R and R Studio. You showed off how easy it is to setup and how you can get nice looking data visualizations with only a little code.
The code samples would be easier for readers to copy and paste if you use a <pre> tag to wrap them, and you might have gone into a little more detail in the first section for those not used to installing software like this, but overall this was a very effective tutorial.